Home /
Expert Answers /
Earth Sciences /
sample-psychrometric-chart-use-the-chart-from-weather-toolkit-6-0-mixing-wet-bulb-wb-temperatur-pa834
(Solved): Sample Psychrometric Chart (Use the Chart from Weather Toolkit 6.0 MIXING WET BULB (WB) TEMPERATUR ...
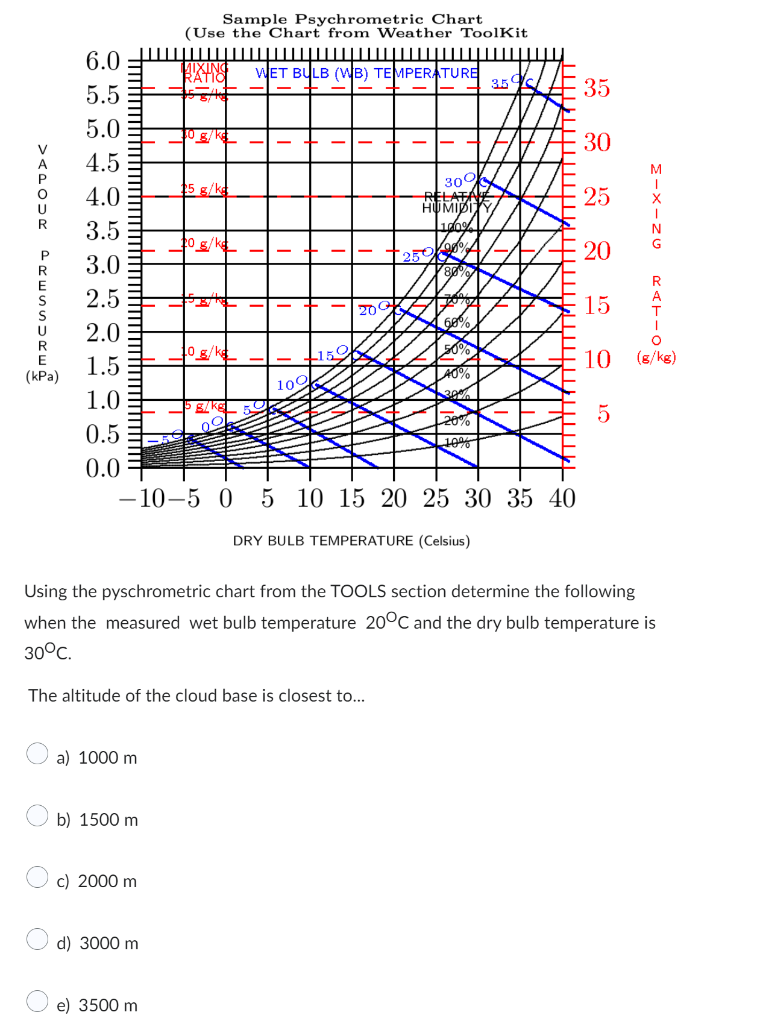
Sample Psychrometric Chart (Use the Chart from Weather Toolkit 6.0 MIXING WET BULB (WB) TEMPERATURE 5.5 3.5 5.0 10_g/kg 4.5 4.0 25 g/kg 30 RELATA HUMIDI 3.5 20 g/kg 9 3.0 80% 2.5 20% 2.0 68% 10 g/kg 50% 1.5 L40% 100 1.0 30% g/kgl 00 20% 5 0.5 10% 0.0 -10-5 0 5 10 15 20 25 30 35 40 DRY BULB TEMPERATURE (Celsius) Using the pyschrometric chart from the TOOLS section determine the following when the measured wet bulb temperature 20°C and the dry bulb temperature is 30°C. The altitude of the cloud base is closest to... a) 1000 m b) 1500 m c) 2000 m d) 3000 m e) 3500 m PO PRESE (kPa) L159 20 25 35 30 25 20 15 10 (g/kg) 10 MIXING RATION