Home /
Expert Answers /
Statistics and Probability /
sample-data-distribution-of-the-studentized-range-q-values-the-table-avallable-below-shows-thre-pa273
(Solved): Sample Data Distribution of the Studentized Range (q-values) The table avallable below shows thre ...
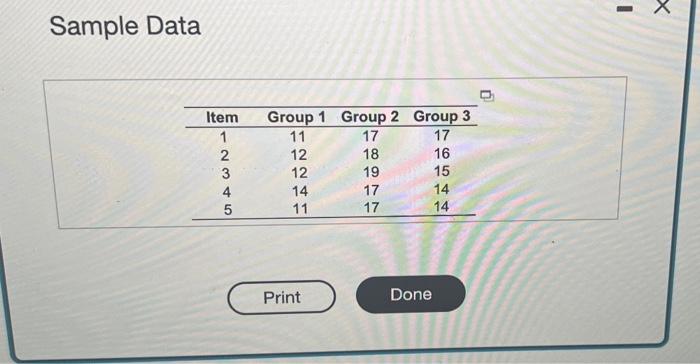
Sample Data
Distribution of the Studentized Range (q-values)
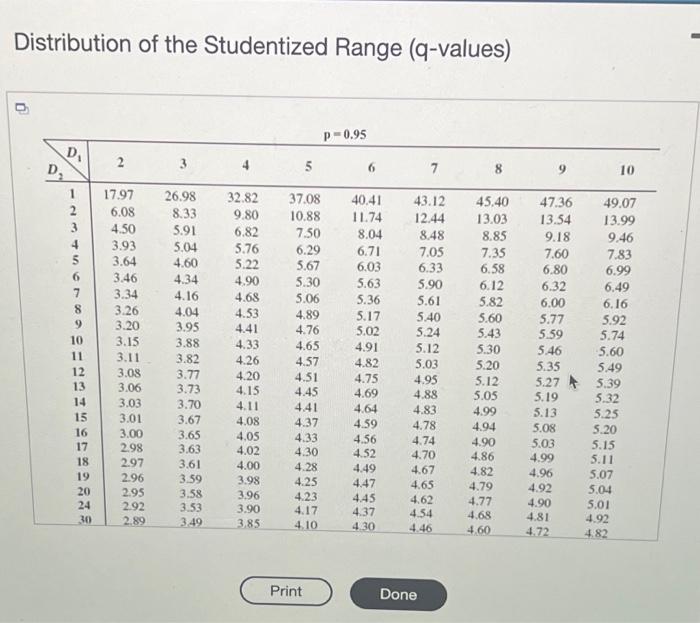
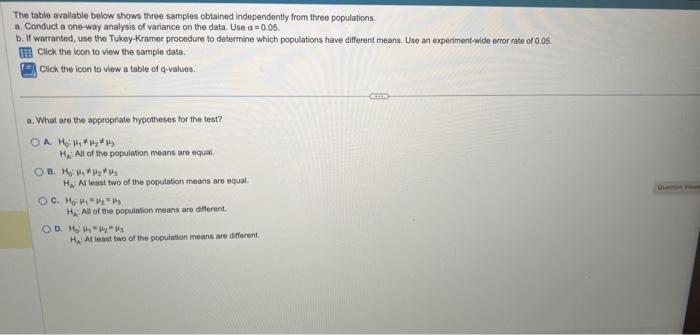
The table avallable below shows three samples obtained independently from three populations. a. Conduct a one-way analysis of variance on the data. Use \( \alpha=0.05 \). b. If warranted, use the Tukey-Kramer procedure to determine which populations have different means. Use an experiment-wide error rate of a.05. Click the loon to view the sample data. Click the icon to view a table of q-values. a. What are the appropriate hypotheses for the test? A. \( \mathrm{H}_{0}^{2} \mu_{1} \neq \mu_{2} \neq \mu_{3} \) \( H_{A}: \) All of the population means are equal. B. \( H_{5}: \mu_{2} \neq \mu_{2} \neq \mu_{3} \) \( H_{A} \) : Al least two of the population means are equal. C. \( \mathrm{H}_{0} \mathrm{H}_{2}=\mu_{2}=\mu_{3} \) \( H_{A} \) : Ay of the population means are dillerent. D. \( H_{3}: \mu_{1}=\mu_{2}=\mu_{3} \) \( H_{n} \) At least two of the popuintion means are different.
Expert Answer
Solution Given that, From the provided information: Item Group- 1 Group- 2 Group- 3 1 11 17 17 2 12 18 16 3 12 19 15 4 14 17 14 5 14 17 14 Total 60 88