Home /
Expert Answers /
Economics /
refer-to-the-diagram-to-the-right-where-a-nominal-interest-rate-the-6-month-annualized-treasury-ra-pa682
(Solved): Refer to the diagram to the right where a nominal interest rate (the 6-month annualized Treasury ra ...
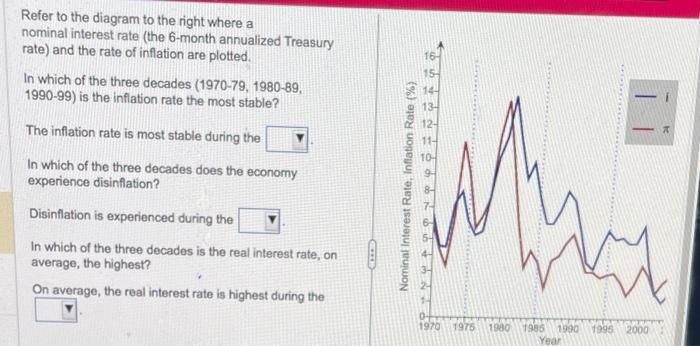
Refer to the diagram to the right where a nominal interest rate (the 6-month annualized Treasury rate) and the rate of inflation are plotted. In which of the three decades (1970-79, 1980-89, \( 1990-99) \) is the inflation rate the most stable? The inflation rate is most stable during the In which of the three decades does the economy experience disinflation? Disinflation is experienced during the In which of the three decades is the real interest rate, on average, the highest? On average, the real interest rate is highest during the
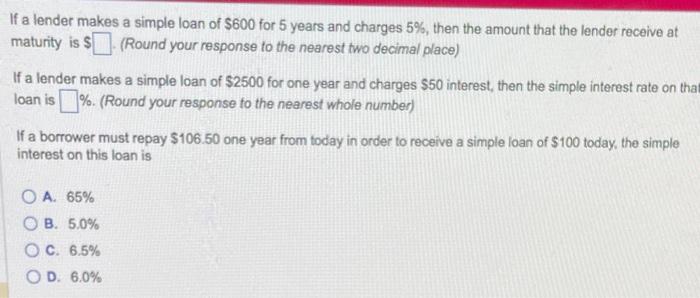
If a lender makes a simple loan of \( \$ 600 \) for 5 years and charges \( 5 \% \), then the amount that the lender receive at maturity is \( \$ \) (Round your response to the nearest two decimal place) If a lender makes a simple loan of \( \$ 2500 \) for one year and charges \( \$ 50 \) interest, then the simple interest rate on tha loan is \%. (Round your response to the nearest whole number) If a borrower must repay \( \$ 106.50 \) one year from today in order to receive a simple loan of \( \$ 100 \) today, the simple interest on this loan is A. \( 65 \% \) B. \( 5.0 \% \) C. \( 6.5 \% \) D. \( 6.0 \% \)
Expert Answer
ANSWER :: A) Stability in inflation rate implies minimum fluctuation. It can be seen that the inflation line is the least fluctuating (changing by just small bits) in the decade of 1990-1999. It starts at nearly 5% to end at around 3.9% in the graph.