Home /
Expert Answers /
Chemistry /
refer-to-the-acid-base-titration-curve-shown-below-this-figure-depicts-39-nbsp-nbsp-pa443
(Solved): Refer to the acid-base titration curve shown below. This figure depicts _______. ' ...
Refer to the acid-base titration curve shown below. This figure depicts _______.
'
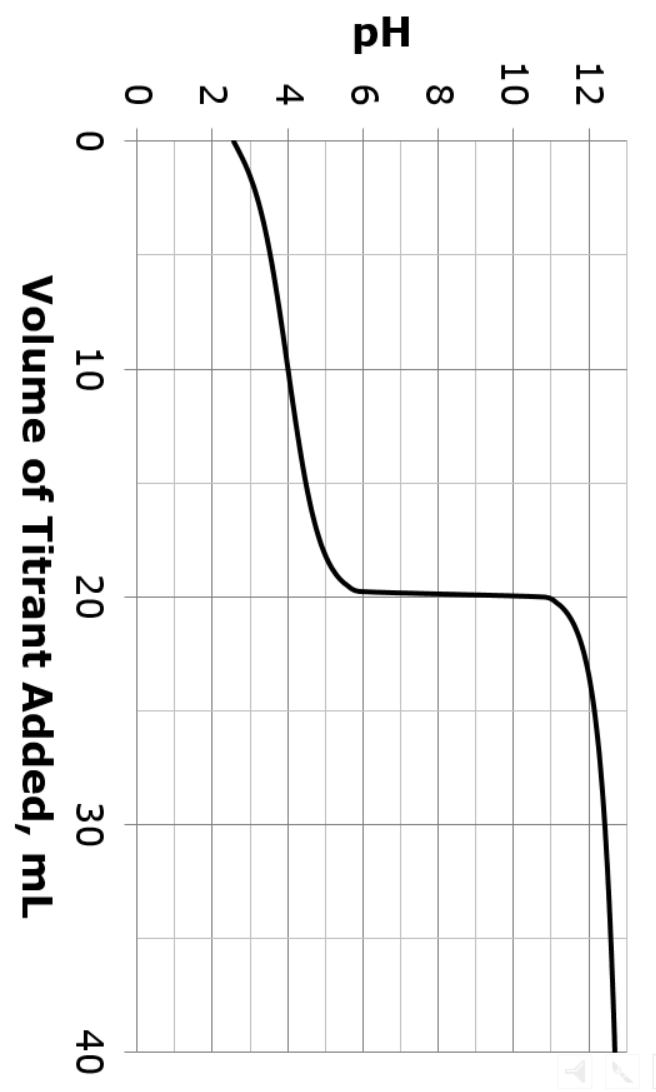
Select one:
a. Titration of a strong acid with a strong base.
b. The figure could depict more than one of these scenarios.
c. Titration of a weak acid with a strong base.
d. Titration of a weak base with a strong acid.
e. Titration of a strong base with a strong acid.
Expert Answer
Soln- The correct option is C -Titration of a weak acid with a strong base. Because the starting