Home /
Expert Answers /
Operations Management /
refer-to-table-sb-1-factors-for-computing-control-chart-limits-3-sigma-for-this-problem-twelve-pa562
(Solved): Refer to Table SB 1- Factors for Computing Control Chart Limits. (3 sigma) for this problem. Twelve ...
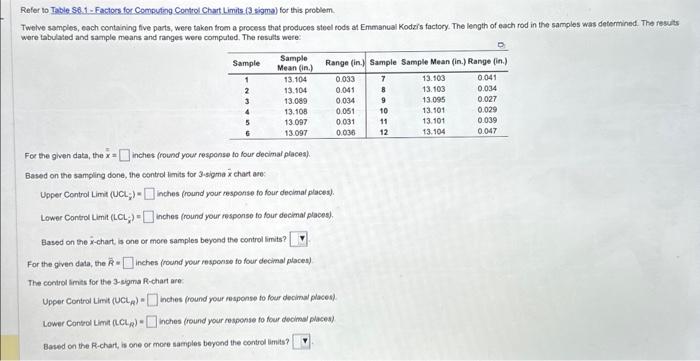
Refer to Table SB 1- Factors for Computing Control Chart Limits. (3 sigma) for this problem. Twelve samples, each containing five parts, were taken trom a process that produces steel rods at Emmanual Kodzis factory. The length of each rod in the samples was determined. The resuts wore tabulated and sample means and ranges wore computed. The results were: For the given data, the inches (round your response to four decimal places). Based on the sampling done, the control limits for 3-sigma chart are: Upper Control Limit (UCL- Inches (round your response fo four decimal places). Lower Control inches (round your response fo four decimal places). Based on the -chart is one of more samples beyond the control limits? For the given data, the = inches (round your response fo four decimal places) The control limes for the 3 -sigma -chart are: Upper Control Limit (UCL ) = inches (round your response to four decimal places). Lower Control Uma hohes (round your response fo four decimal places) Based on the R-chart, is one or more samples beyond the control limis?
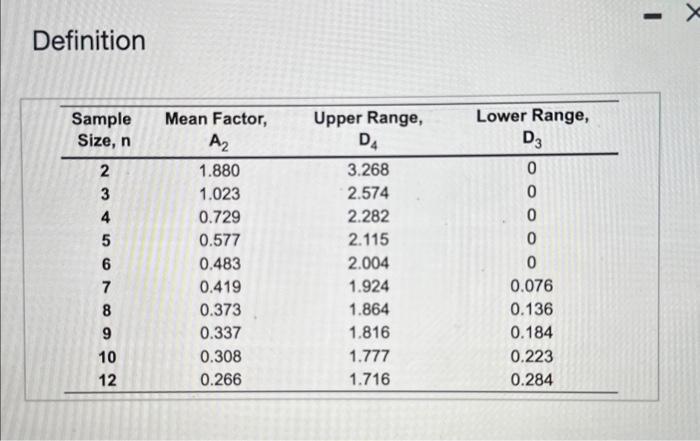
Definition