Home /
Expert Answers /
Statistics and Probability /
question-2-follow-the-instructions-to-create-a-standard-normal-distribution-graph-and-answer-the-f-pa265
(Solved): Question 2: Follow the instructions to create a standard normal distribution graph and answer the f ...
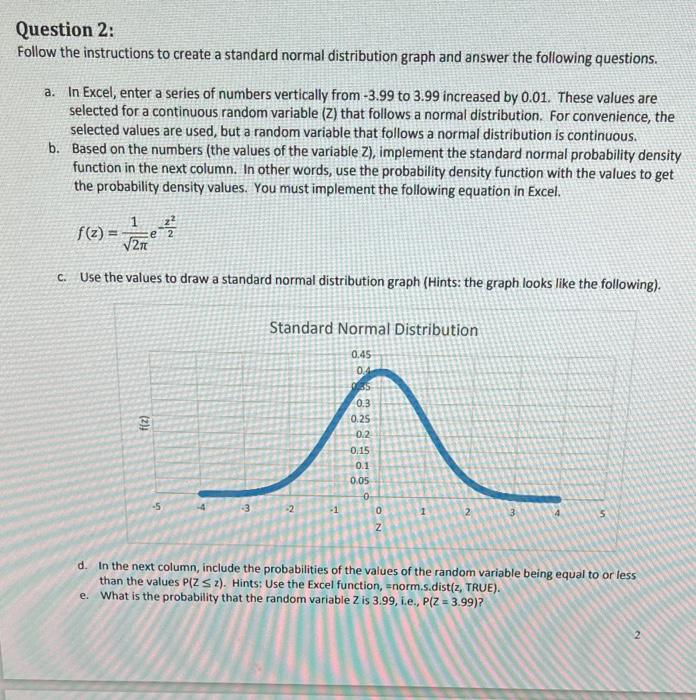
Question 2: Follow the instructions to create a standard normal distribution graph and answer the following questions. a. In Excel, enter a series of numbers vertically from -3.99 to 3.99 increased by 0.01. These values are selected for a continuous random variable (Z) that follows a normal distribution. For convenience, the selected values are used, but a random variable that follows a normal distribution is continuous. b. Based on the numbers (the values of the variable Z), implement the standard normal probability density function in the next column. In other words, use the probability density function with the values to get the probability density values. You must implement the following equation in Excel. f(2)=?² Use the values to draw a standard normal distribution graph (Hints: the graph looks like the following). C. (2) -5 Standard Normal Distribution 0.45 04 05 0.3 0.25 0.2 -2 -1 0,15 0.1 0.05 0 ON d. In the next column, include the probabilities of the values of the random variable being equal to or less than the values P(ZS z). Hints: Use the Excel function, norm.s.dist(z, TRUE). e. What is the probability that the random variable Z is 3.99, i.e., P(Z = 3.99)?
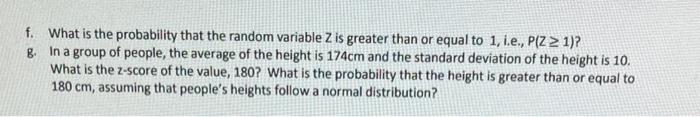
f. What is the probability that the random variable Z is greater than or equal to 1, i.e., P(Z ? 1)? g. In a group of people, the average of the height is 174cm and the standard deviation of the height is 10. What is the z-score of the value, 180? What is the probability that the height is greater than or equal to 180 cm, assuming that people's heights follow a normal distribution?
Expert Answer
Formula to write the pdf of the standard normal distribution: =(1/SQRT(2*PI()))*(EXP(-(A1*A1)/2)) Formula to get the value of P(Z <= z): =NORM.DIST(A1,0,1,TRUE) Formula to get answer of Part f: =1-NORM.DIST(1,0,1,TRUE) Formula to get answer of Part g