Home /
Expert Answers /
Statistics and Probability /
q5-please-help-the-following-scatter-plot-along-with-the-least-squares-regression-line-shows-a-li-pa618
(Solved): Q5. please help! The following scatter plot along with the least- squares regression line shows a li ...
Q5. please help!
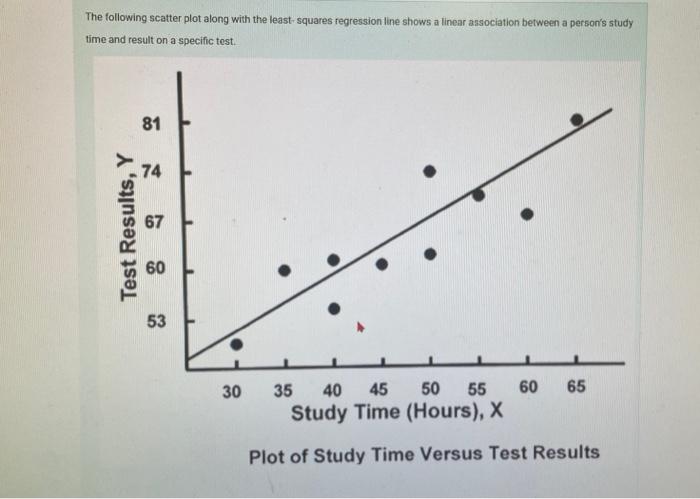
The following scatter plot along with the least- squares regression line shows a linear association between a person's study time and result on a specific test. Plot of Study Time Versus Iest Kesuits
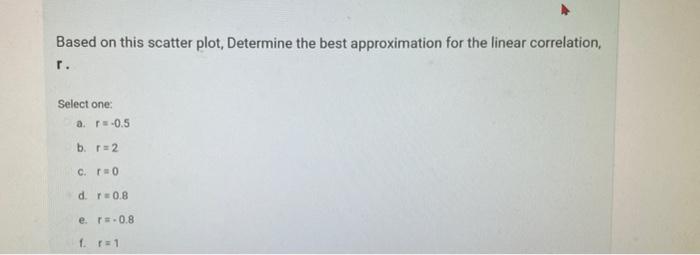
Based on this scatter plot, Determine the best approximation for the linear correlation, r. Select one: a. \( r=-0.5 \) b. \( r=2 \) c. \( r=0 \) d. \( r=0.8 \) e. \( r=-0.8 \) f. \( r=1 \)
Expert Answer
Here, option D is correct. I. E r=0.8 Because as we know that, The correlation coefficient lies between 0 and 1. Positive correlation