Home /
Expert Answers /
Electrical Engineering /
q2-use-matlab-to-plot-the-frequency-response-bode-plot-of-the-following-circuit-after-finding-the-pa990
(Solved): Q2 Use MATLAB to plot the frequency response (Bode Plot) of the following circuit after finding the ...
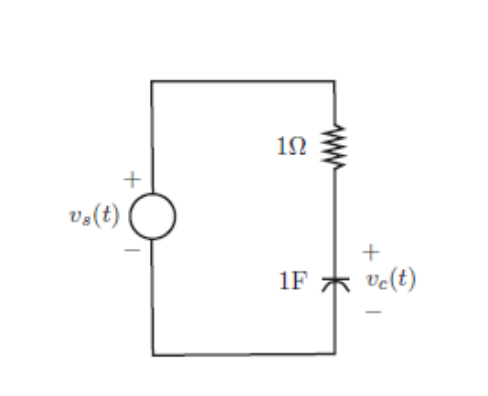
Q2 Use MATLAB to plot the frequency response (Bode Plot) of the following circuit after finding the transfer function. Is the system BIBO stable? Why? What kind of filter is this? How much should you change the capacitor value to make its cutoff frequency at 1MHz?
Expert Answer
the circuit is drawn in the frequency domain, the impedance of the capacitor is apply KVL in the l...