Home /
Expert Answers /
Economics /
q2-answer-the-following-sub-questions-based-on-the-graph-below-that-represents-the-supply-and-dem-pa240
(Solved): Q2. Answer the following sub-questions based on the graph below that represents the supply and dem ...
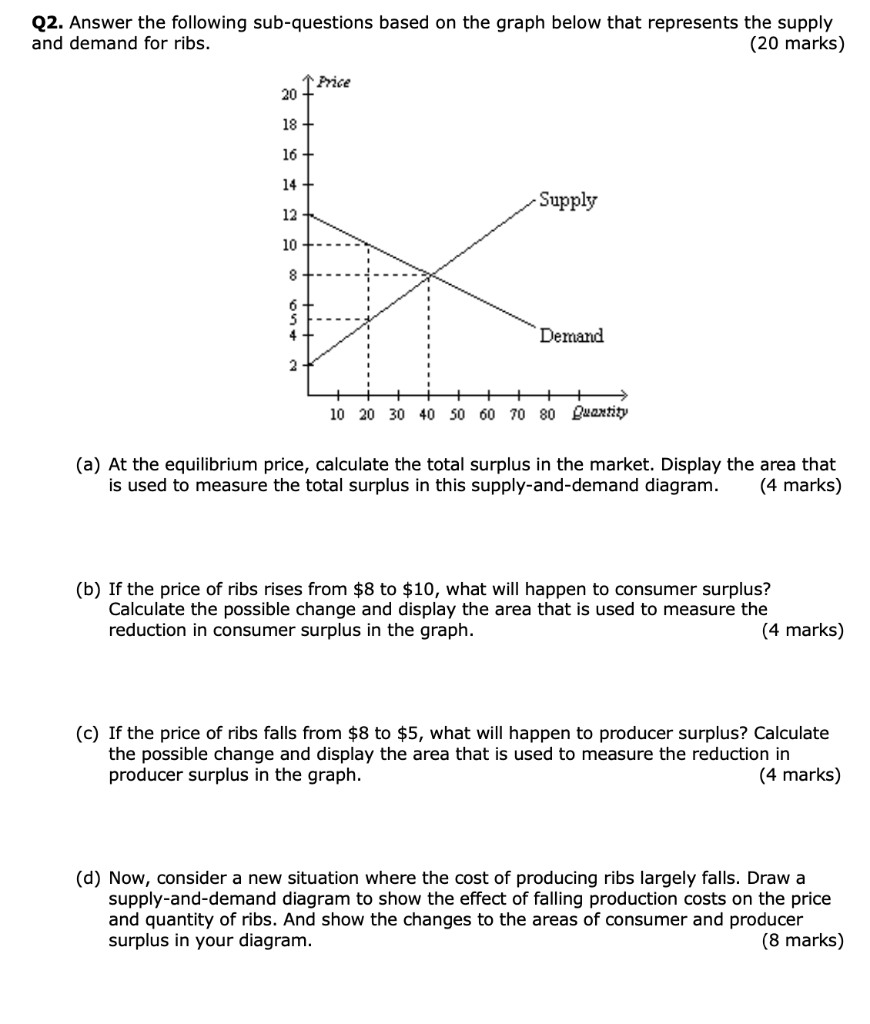
Q2. Answer the following sub-questions based on the graph below that represents the supply and demand for ribs. (20 marks) (a) At the equilibrium price, calculate the total surplus in the market. Display the area that is used to measure the total surplus in this supply-and-demand diagram. (4 marks) (b) If the price of ribs rises from \( \$ 8 \) to \( \$ 10 \), what will happen to consumer surplus? Calculate the possible change and display the area that is used to measure the reduction in consumer surplus in the graph. (4 marks) (c) If the price of ribs falls from \( \$ 8 \) to \( \$ 5 \), what will happen to producer surplus? Calculate the possible change and display the area that is used to measure the reduction in producer surplus in the graph. (4 marks) (d) Now, consider a new situation where the cost of producing ribs largely falls. Draw a supply-and-demand diagram to show the effect of falling production costs on the price and quantity of ribs. And show the changes to the areas of consumer and producer surplus in your diagram. (8 marks)
Expert Answer
Notes: 1) Equilibrium is at intersection of Demand and Supply curves with equilibrium price $8 and quantity 40. 2) As price increases (decreases), Con
