Home /
Expert Answers /
Computer Science /
python-suppose-we-have-a-dataframe-named-df-and-we-want-to-plot-a-bar-chart-with-the-data-in-column-pa189
(Solved): python Suppose we have a dataframe named df and we want to plot a bar chart with the data in column ...
python
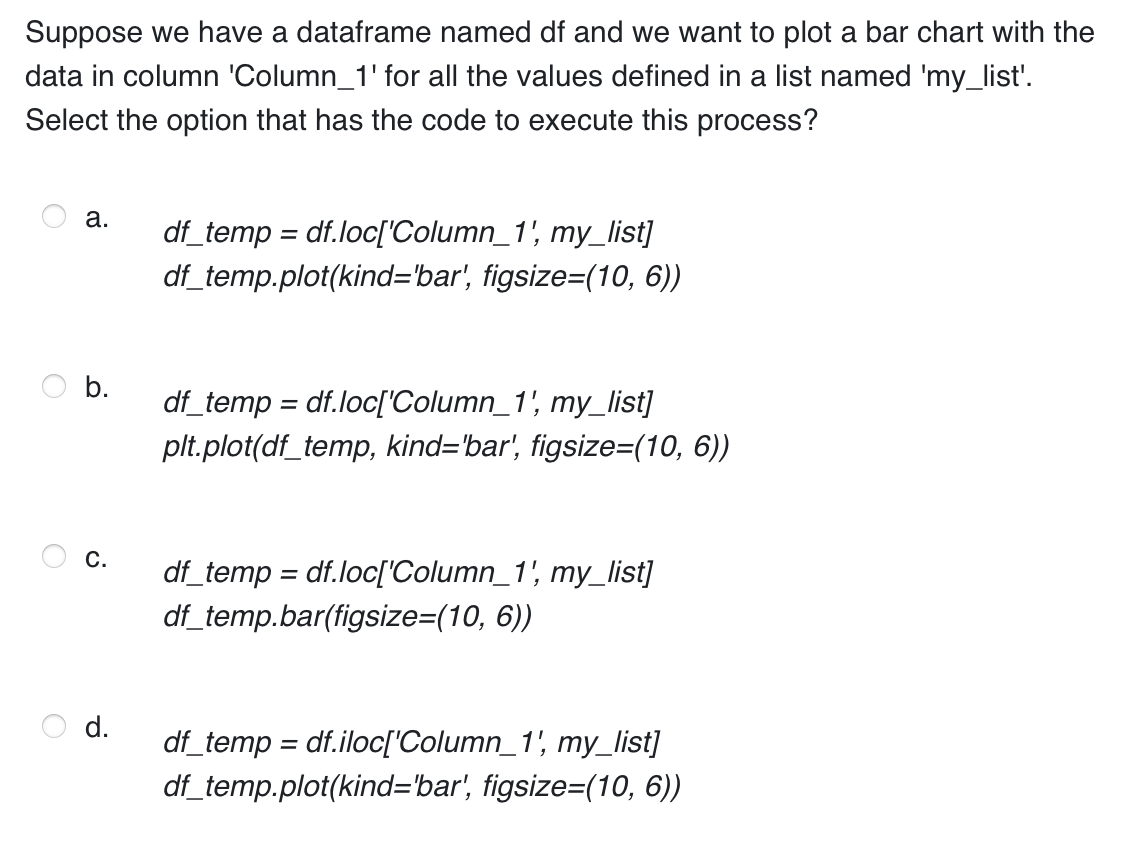
Suppose we have a dataframe named df and we want to plot a bar chart with the data in column 'Column_1' for all the values defined in a list named 'my_list'. Select the option that has the code to execute this process? a. b. df_temp=df.loc['Column_1', my_list] df_temp.plot(kind='bar', figsize=(10, 6)) d. df_temp=df.loc['Column_1', my_list] plt.plot(df_temp, kind='bar', figsize=(10, 6)) C. df_temp=df.loc['Column_1', my_list] df_temp.bar(figsize=(10, 6)) df_temp=df.iloc['Column_1', my_list] df_temp.plot(kind='bar', figsize=(10, 6))