Home /
Expert Answers /
Computer Science /
python-import-pandas-as-pd-import-matplotlib-import-matplotlib-pyplot-as-plt-you-should-us-pa491
(Solved): (Python) #import pandas as pd #import matplotlib #import matplotlib.pyplot as plt !!!!You should us ...
(Python)
#import pandas as pd
#import matplotlib
#import matplotlib.pyplot as plt
!!!!You should use 'groupby'
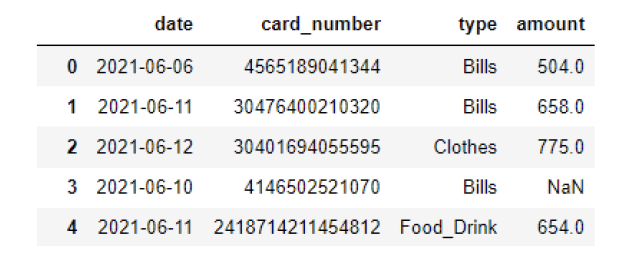
Q1: Fill the missing value of the 'amount' variable with the median value of the 'amount' for each type.
Q1 : Plot a line diagram of daily(='date') transactions by consumption type. ('amount' is not daily transactions)
Q2: Plot the sum of the total transaction volume(='amount') by consumption type as a bar plot.
date 0 2021-06-06 1 2021-06-11 2 2021-06-12 3 2021-06-10 4 2021-06-11 card_number 4565189041344 30476400210320 30401694055595 4146502521070 2418714211454812 type amount Bills 504.0 Bills 658.0 Clothes 775.0 Bills NaN Food_Drink 654.0
Expert Answer
ACCORDING TO CHEGG GUIDELINES, WE ARE ONLY ALLOWED TO SOLVE ONE QUESTION AT A TIME AND WE CAN NOT VIOLATE THE GUIDELINES SO SORRY FOR THE INCONVENIENCE 1)THE CODE IN PYTHON # import the libr
