Home /
Expert Answers /
Computer Science /
python-find-the-corresponding-histogram-for-t-hist-39-x-39-and-t-hist-39-y-39-co-pa261
(Solved): Python. Find the corresponding histogram for t.hist('x') and t.hist('y'). Co ...
Python. Find the corresponding histogram for t.hist('x') and t.hist('y').
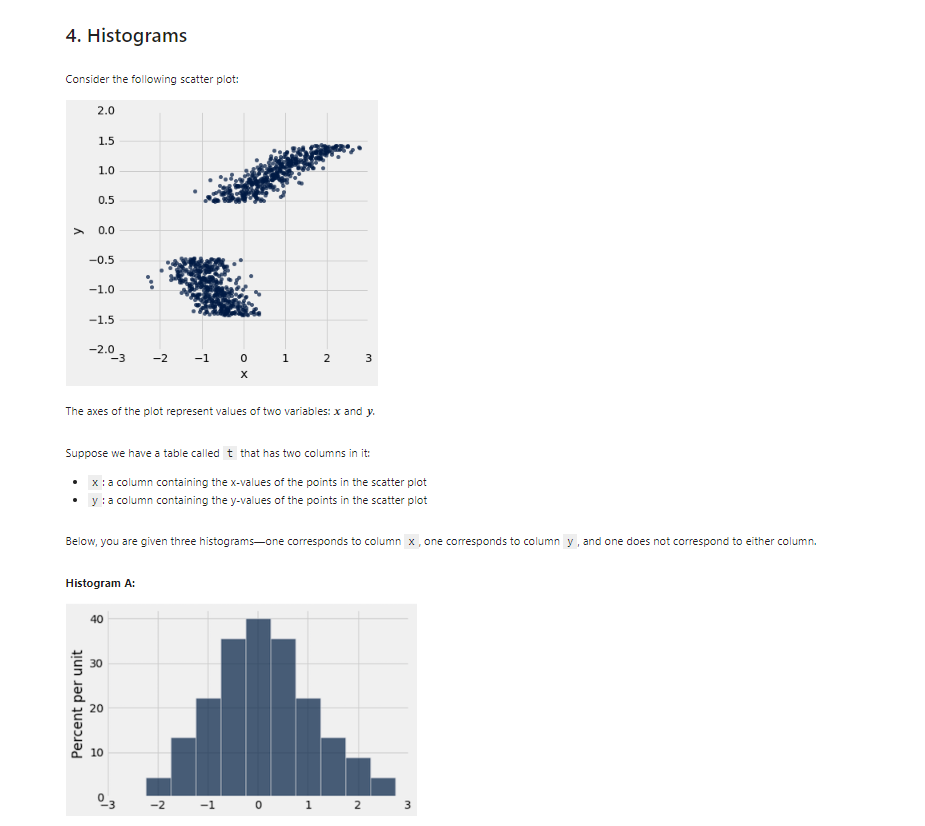
Consider the following scatter plot: The axes of the plot represent values of two variables: and . Suppose we have a table called that has two columns in it: - : a column containing the x-values of the points in the scatter plot - : a column containing the -values of the points in the scatter plot Below, you are given three histograms-one corresponds to column , one corresponds to column , and one does not correspond to either column. Histogram A:
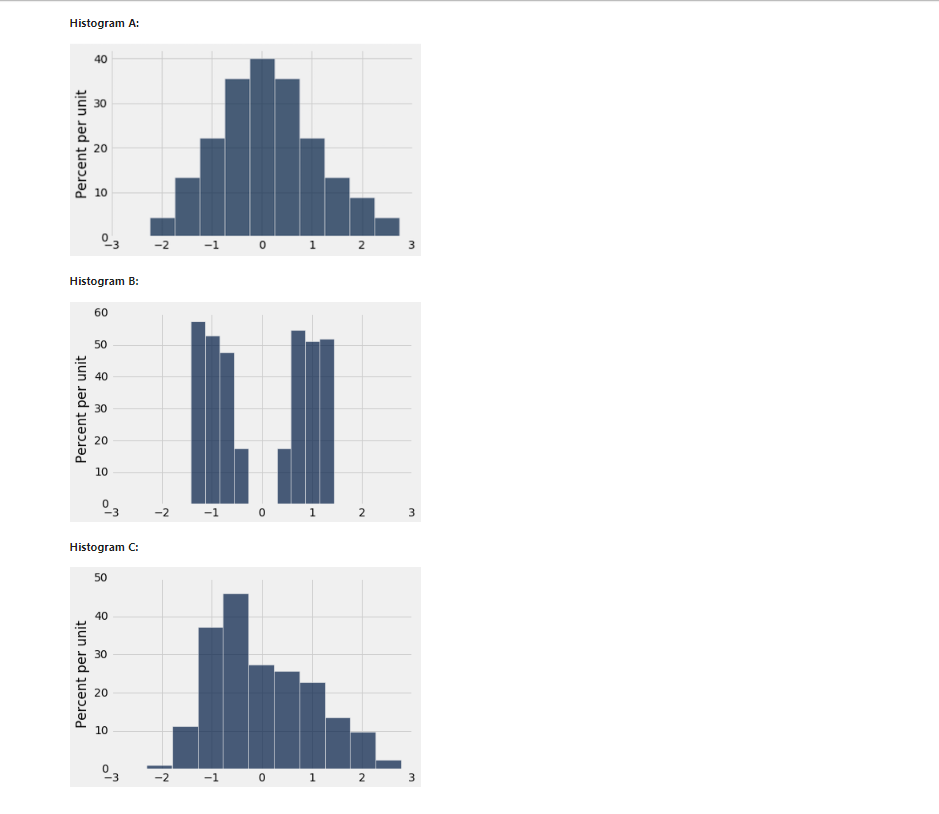
Histogram A: Histogram B: Histogram C:
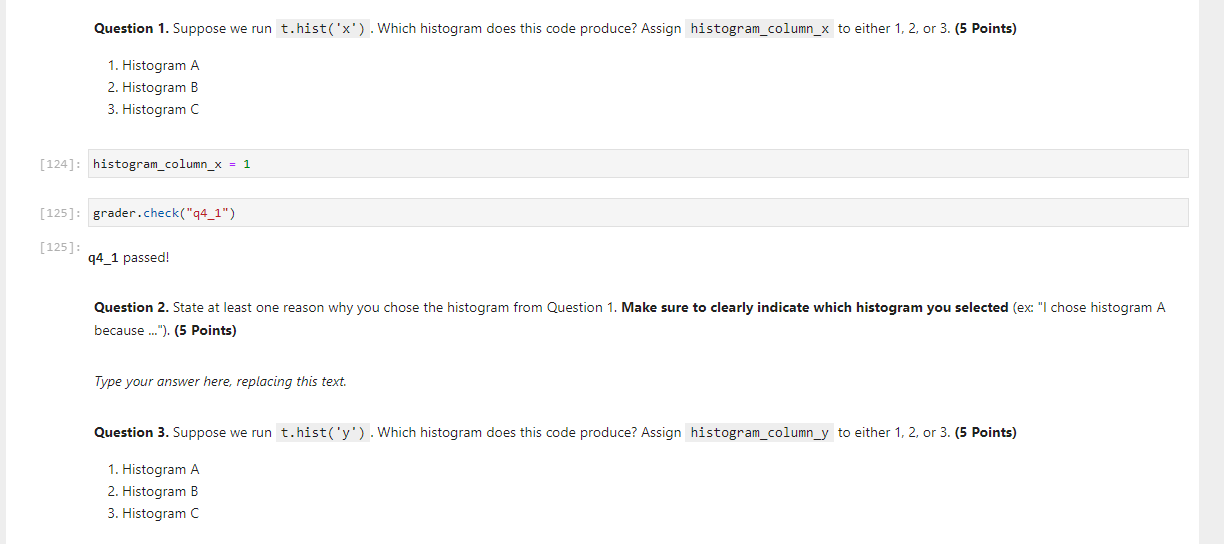
Question 1. Suppose we run Which histogram does this code produce? Assign histogram_column_ to either 1,2 , or 3 . (5 Points) 1. Histogram A 2. Histogram B 3. Histogram C ]: histogram_column_x ]: grader.check(" q4_1 passed! Question 2. State at least one reason why you chose the histogram from Question 1. Make sure to clearly indicate which histogram you selected (ex: "I chose histogram A because ..."). (5 Points) Type your answer here, replacing this text. Question 3. Suppose we run Which histogram does this code produce? Assign histogram_column_y to either 1,2, or 3. (5 Points) 1. Histogram A 2. Histogram B 3. Histogram C
Expert Answer
SOLUTION:-t.hist(x) matches with Histogram B. We can con