Home /
Expert Answers /
Chemistry /
pure-cyclohexane-cooling-curve-data-1-graph-the-cooling-data-temperature-y-axis-vs-time-x-axis-pa598
(Solved): Pure Cyclohexane Cooling Curve Data 1) Graph the cooling data Temperature (y-axis) vs Time (x-axis ...
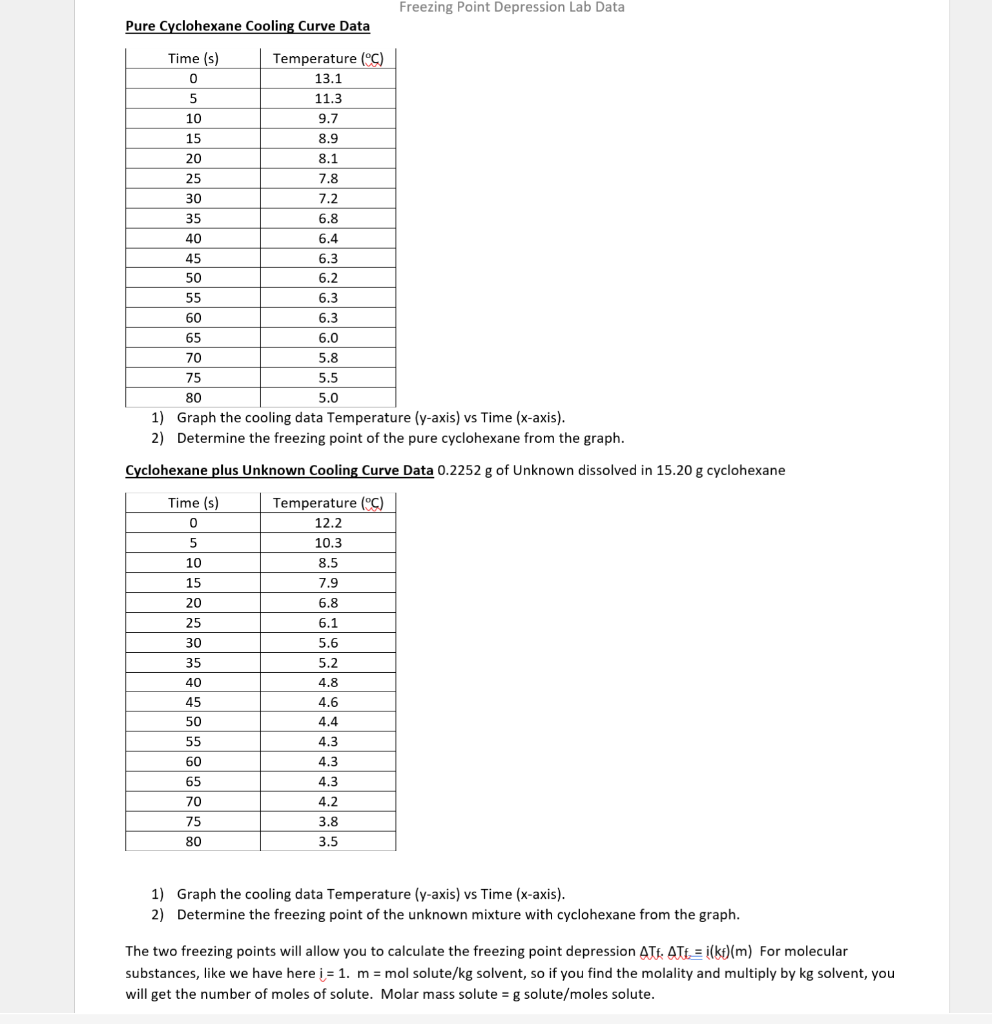
Pure Cyclohexane Cooling Curve Data 1) Graph the cooling data Temperature (y-axis) vs Time (x-axis). 2) Determine the freezing point of the pure cyclohexane from the graph. Cyclohexane plus Unknown Cooling Curve Data \( 0.2252 \mathrm{~g} \) of Unknown dissolved in \( 15.20 \mathrm{~g} \) cyclohexane 1) Graph the cooling data Temperature (y-axis) vs Time (x-axis). 2) Determine the freezing point of the unknown mixture with cyclohexane from the graph. The two freezing points will allow you to calculate the freezing point depression \( \Delta \mathrm{Tf}_{\mathrm{f}} \Delta \mathrm{Tf}_{\mathrm{z}}=\mathrm{i}(\mathrm{kf})(\mathrm{m}) \) For molecular substances, like we have here \( \mathrm{i}=1 . \mathrm{m}=\mathrm{mol} \) solute/ \( \mathrm{kg} \) solvent, so if you find the molality and multiply by kg solvent, you will get the number of moles of solute. Molar mass solute \( =\mathrm{g} \) solute/moles solute.
