Project: Part 5 – Final Report Assignment
You will submit a final report, written in Word (or similar word processing software), based on
your findings and submissions from Parts 1 – 4. It is highly suggested you not submit this paper
without first reviewing all the feedback from your instructor on submissions from all parts of this
project. Be sure to ask any questions you may have on your feedback.
This final submission should be three paragraphs and summarize your entire project.
The project must be submitted in paragraph form and not just a list of the calculations from your
project. Be sure your paragraphs flow (not just listing the answers to the questions, but complete
sentences with transitions) and are written in third person. The goal is not to define all the terms,
nor describe how they are calculated. Rather, you should describe the results and what they told
you about online students. You are presenting your results to a nonstatistical audience, do not
describe the calculations, describe your results. It should include the following:
? Paragraph 1:
o Brief summary of the U.S. News Data: The Average Online Bachelor’s Student
article, including the source
? A direct link to this article is located in the Learn section of Module 7:
Week 7 entitled Read: U.S. News Data: The Average Online Bachelor’s
Student.
o Define the population, sample, and statistic for the study
o Statement of the two claims in the article that were tested in this project
o Null and alternative hypothesis for both tests run for this project (in words)
? Paragraph 2 (address the claim about the mean):
o Summary of sample statistics (mean, standard deviation, median, quartiles,
sample size)
o Confidence interval, along with interpretation of the confidence interval
o Description of hypothesis test (alpha, test statistic, p-value, conclusion,
interpretation)
? Paragraph 3 (address the claim about the proportion):
o Summary of sample statistics (sample size, successes, proportion)
o Confidence interval, along with interpretation of the confidence interval
o Description of hypothesis test (alpha, test statistic, p-value, conclusion,
interpretation)


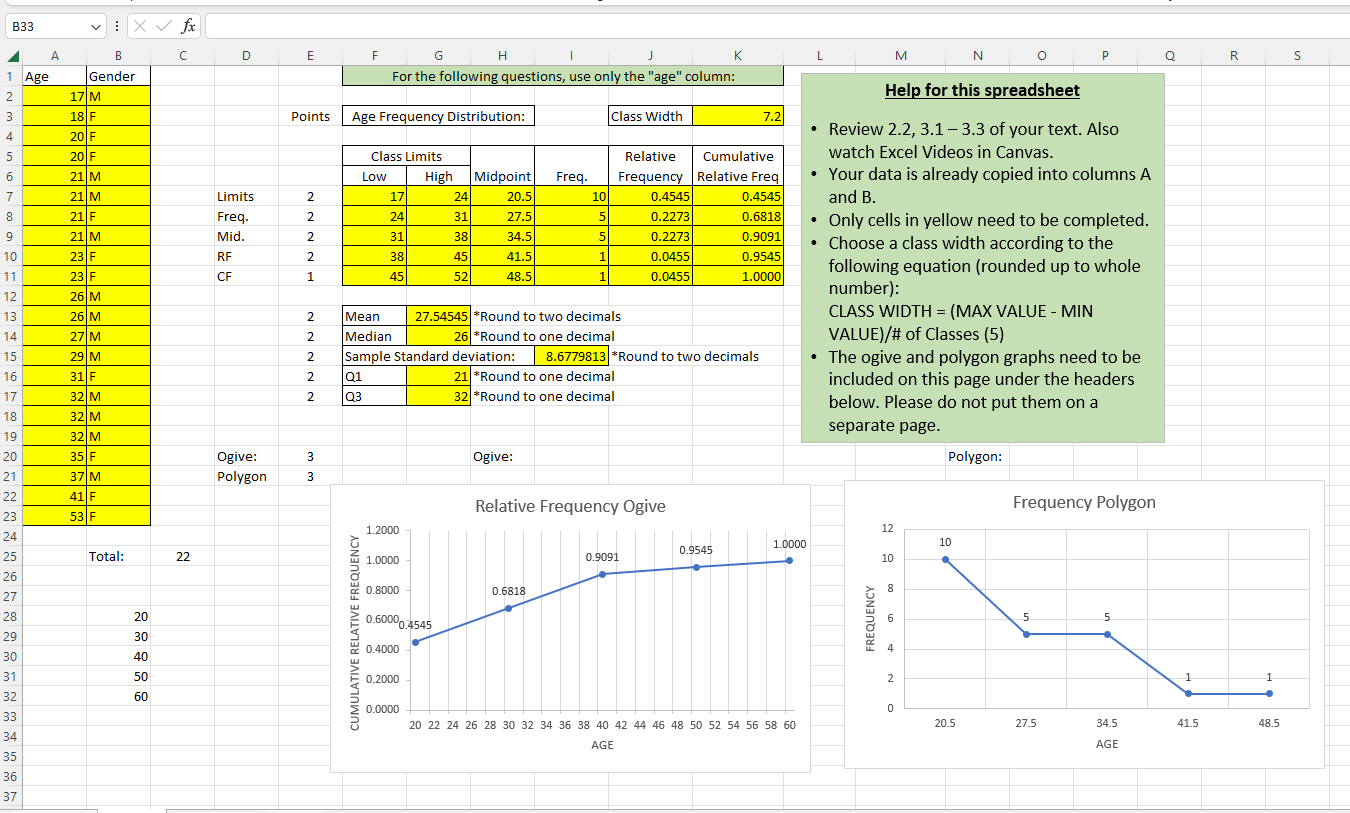
\begin{tabular}{|l|l|l|} \hline \multicolumn{2}{l|}{ B33 } & V \\ \hline \multicolumn{1}{|c|}{ A } & \multicolumn{1}{|c|}{ B } \\ \hline 1 & Age & Gender \\ \hline 2 & 17 & M \\ \hline 3 & 18 & F \\ \hline 4 & 20 & F \\ \hline 5 & 20 & F \\ \hline 6 & 21 & M \\ \hline 7 & 21 & M \\ \hline 8 & 21 & F \\ \hline 9 & 21 & M \\ \hline 10 & 23 & F \\ \hline 11 & 23 & F \\ \hline 12 & 26 & M \\ \hline 13 & 26 & M \\ \hline 14 & 27 & M \\ \hline 15 & 29 & M \\ \hline 16 & 31 & F \\ \hline 17 & 32 & M \\ \hline 18 & 32 & M \\ \hline 19 & 32 & M \\ \hline 20 & 35 & F \\ \hline 21 & 37 & M \\ \hline 22 & 41 & F \\ \hline 23 & 53 & F \\ \hline \end{tabular} \( f_{x} \) c - Review 2.2, \( 3.1-3.3 \) of your text. Also watch Excel Videos in Canvas. - Your data is already copied into columns \( A \) and \( \mathrm{B} \). - Only cells in yellow need to be completed. - Choose a class width according to the following equation (rounded up to whole number): CLASS WIDTH \( =( \) MAX VALUE \( - \) MIN VALUE)/\# of Classes (5) - The ogive and polygon graphs need to be included on this page under the headers below. Please do not put them on a separate page. Total:
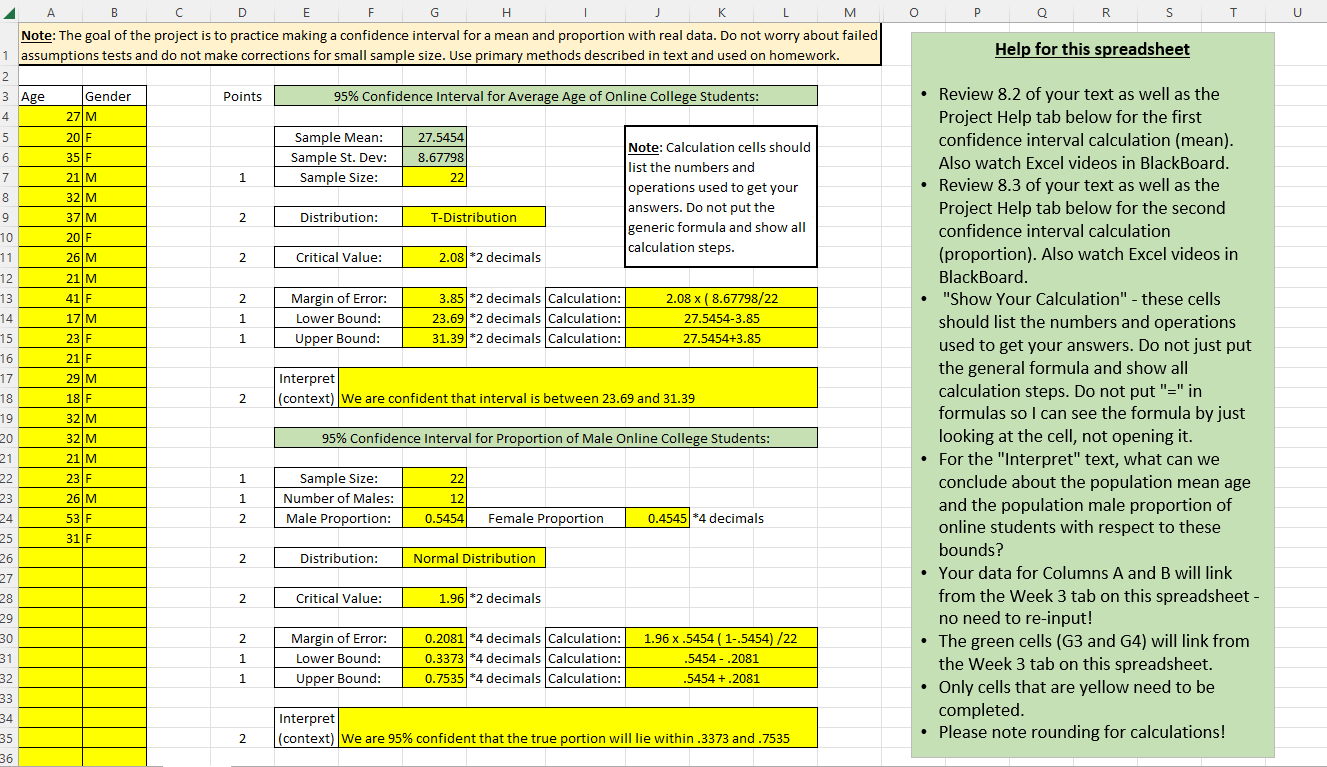
Help for this spreadsheet - Review \( 8.2 \) of your text as well as the Project Help tab below for the first confidence interval calculation (mean). Also watch Excel videos in BlackBoard. - Review \( 8.3 \) of your text as well as the Project Help tab below for the second confidence interval calculation (proportion). Also watch Excel videos in BlackBoard. "Show Your Calculation" - these cells should list the numbers and operations used to get your answers. Do not just put the general formula and show all calculation steps. Do not put "=" in formulas so I can see the formula by just looking at the cell, not opening it. - For the "Interpret" text, what can we conclude about the population mean age and the population male proportion of online students with respect to these bounds? - Your data for Columns A and B will link from the Week 3 tab on this spreadsheet no need to re-input! - The green cells (G3 and G4) will link from the Week 3 tab on this spreadsheet. - Only cells that are yellow need to be completed. - Please note rounding for calculations!
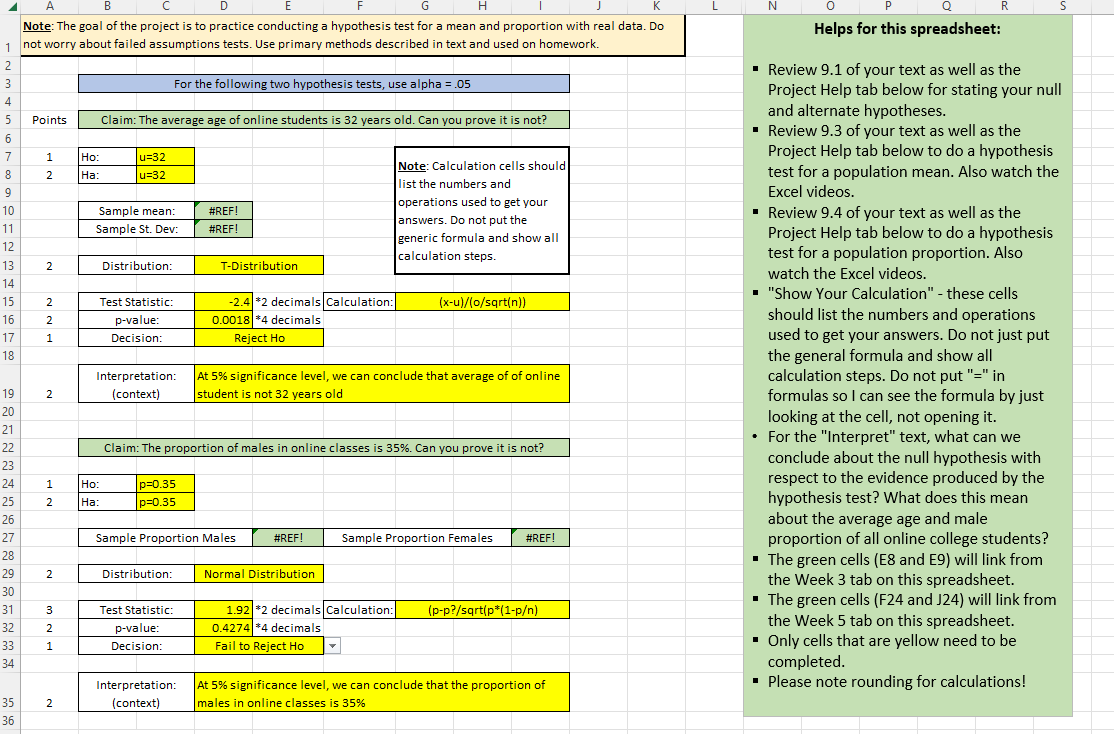
Helps for this spreadsheet: - Review \( 9.1 \) of your text as well as the Project Help tab below for stating your null and alternate hypotheses. - Review \( 9.3 \) of your text as well as the Project Help tab below to do a hypothesis test for a population mean. Also watch the Excel videos. - Review \( 9.4 \) of your text as well as the Project Help tab below to do a hypothesis test for a population proportion. Also watch the Excel videos. - "Show Your Calculation" - these cells should list the numbers and operations used to get your answers. Do not just put the general formula and show all calculation steps. Do not put "=" in formulas so I can see the formula by just looking at the cell, not opening it. - For the "Interpret" text, what can we conclude about the null hypothesis with respect to the evidence produced by the hypothesis test? What does this mean about the average age and male proportion of all online college students? - The green cells (E8 and E9) will link from the Week 3 tab on this spreadsheet. - The green cells (F24 and J24) will link from the Week 5 tab on this spreadsheet. - Only cells that are yellow need to be completed. - Please note rounding for calculations!


