Home /
Expert Answers /
Biology /
produce-a-graph-that-shows-their-respective-niches-and-any-overlap-they-have-your-graph-must-have-ax-pa124
(Solved): Produce a graph that shows their respective niches and any overlap they have.Your graph must have ax ...
Produce a graph that shows their respective niches and any overlap they have.Your graph must have axes labeled and each niche curve must be identified (which mouse it represents). You are given data on seed sizes used by each species and should use it when setting up the axes on the graph.
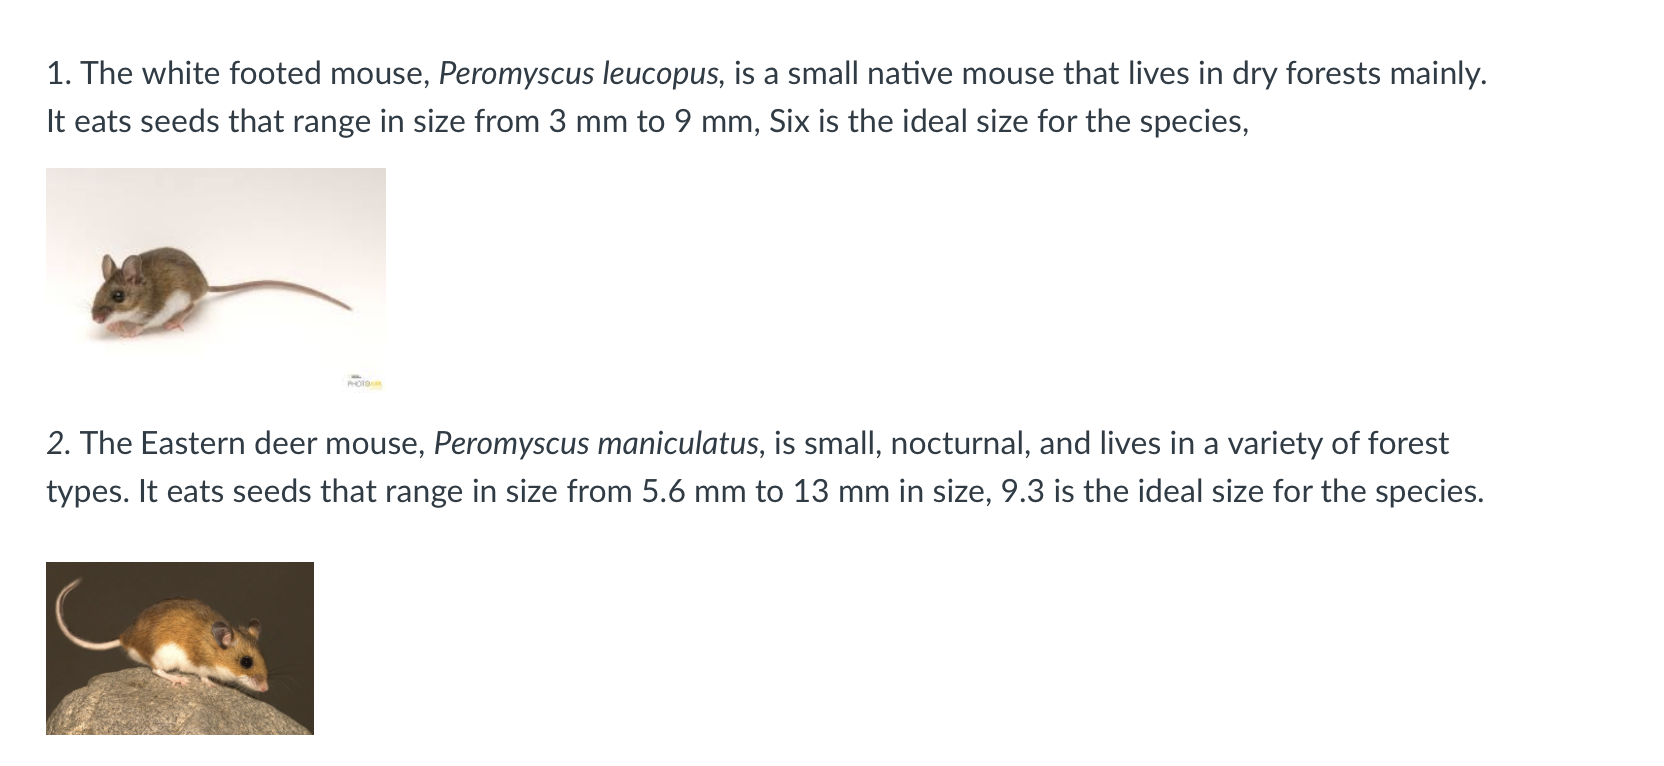
1. The white footed mouse, Peromyscus leucopus, is a small native mouse that lives in dry forests mainly. It eats seeds that range in size from to , Six is the ideal size for the species, 2. The Eastern deer mouse, Peromyscus maniculatus, is small, nocturnal, and lives in a variety of forest types. It eats seeds that range in size from to in size, 9.3 is the ideal size for the species.
Expert Answer
The graph shows the respective niches and niche overlap of both P. leucopus and P. maniculatus