Home /
Expert Answers /
Electrical Engineering /
problem-1-draw-the-magnitude-bode-plot-showing-the-individual-bode-plot-for-each-component-dc-te-pa747
(Solved): Problem 1: Draw the magnitude Bode Plot, showing the individual bode plot for each component (DC te ...
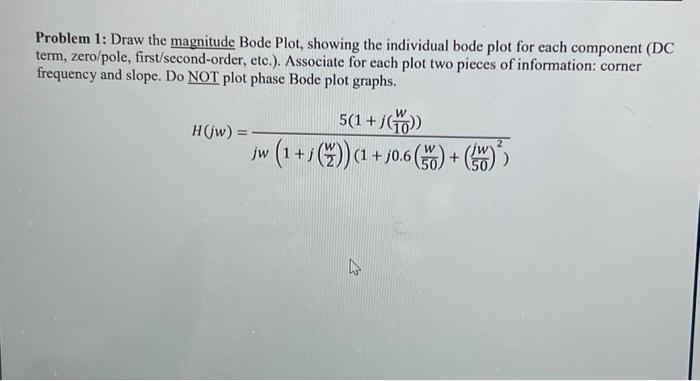
Problem 1: Draw the magnitude Bode Plot, showing the individual bode plot for each component (DC term, zero/pole, first/second-order, etc.). Associate for each plot two pieces of information: corner frequency and slope. Do NOT plot phase Bode plot graphs. \\[ H(j w)=\\frac{5\\left(1+j\\left(\\frac{w}{10}\\right)\\right)}{j w\\left(1+j\\left(\\frac{w}{2}\\right)\\right)\\left(1+j 0.6\\left(\\frac{w}{50}\\right)+\\left(\\frac{j w}{50}\\right)^{2}\\right)} \\]
Expert Answer
The frequency response function of a system is given asThe frequency response function has