Home /
Expert Answers /
Earth Sciences /
pressure-systems-and-precipitation-compare-your-analyzed-map-to-figure-3-pa166
(Solved): pressure systems, and precipitation. Compare your analyzed map to Figure 3 . ...

pressure systems, and precipitation.
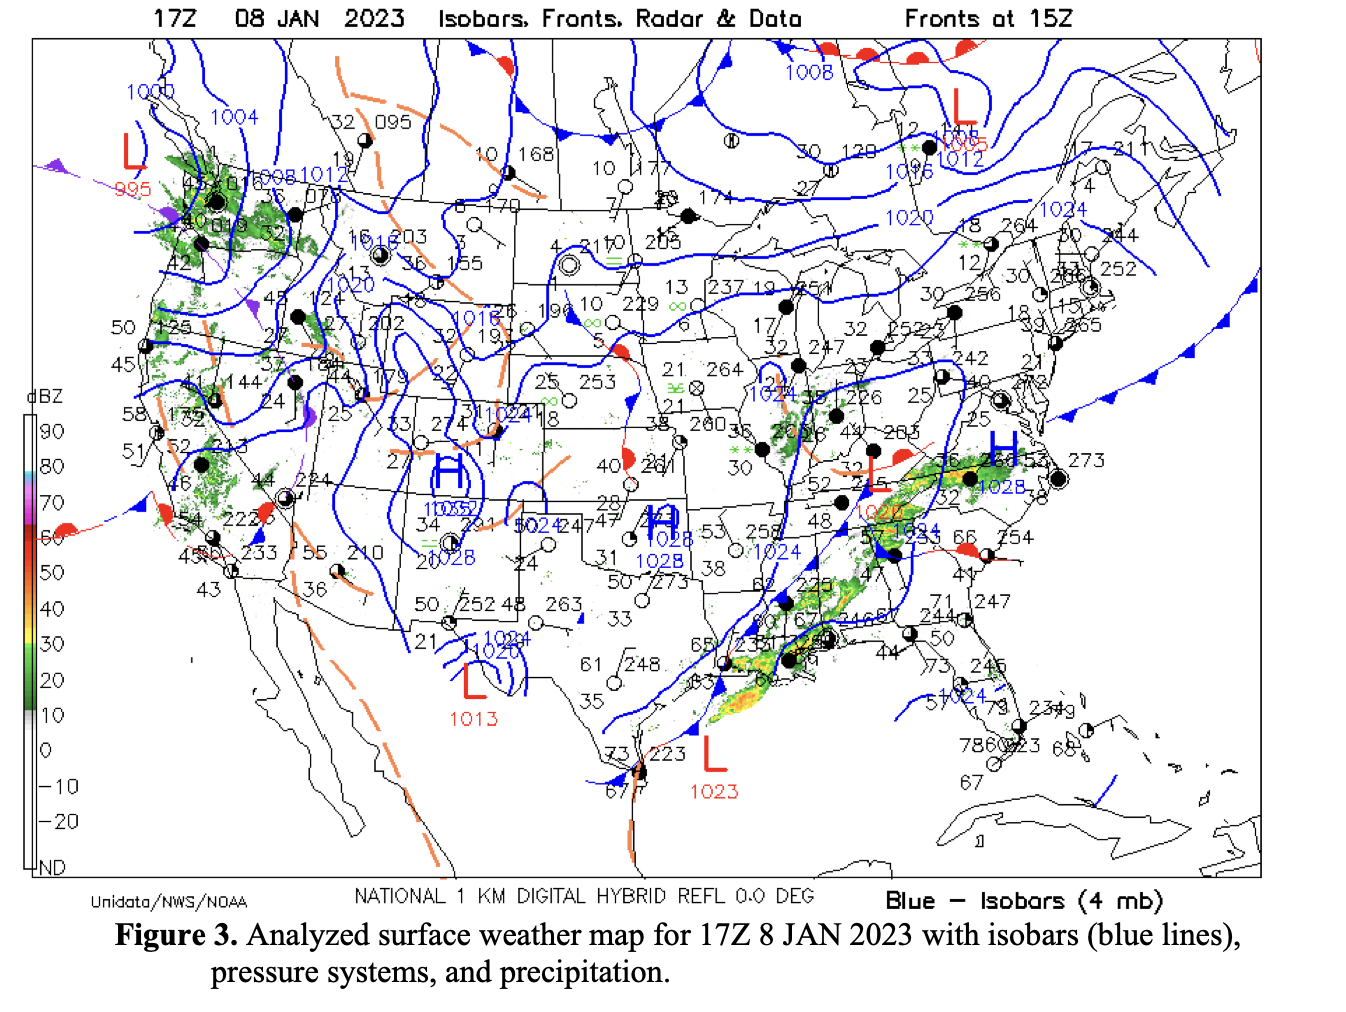
Compare your analyzed map to Figure 3 . The overall isobar patterns on the two maps over the coterminous U.S., particularly for the incoming Pacific Northwest low and the Southern Plains high, are generally a. similar b. very different
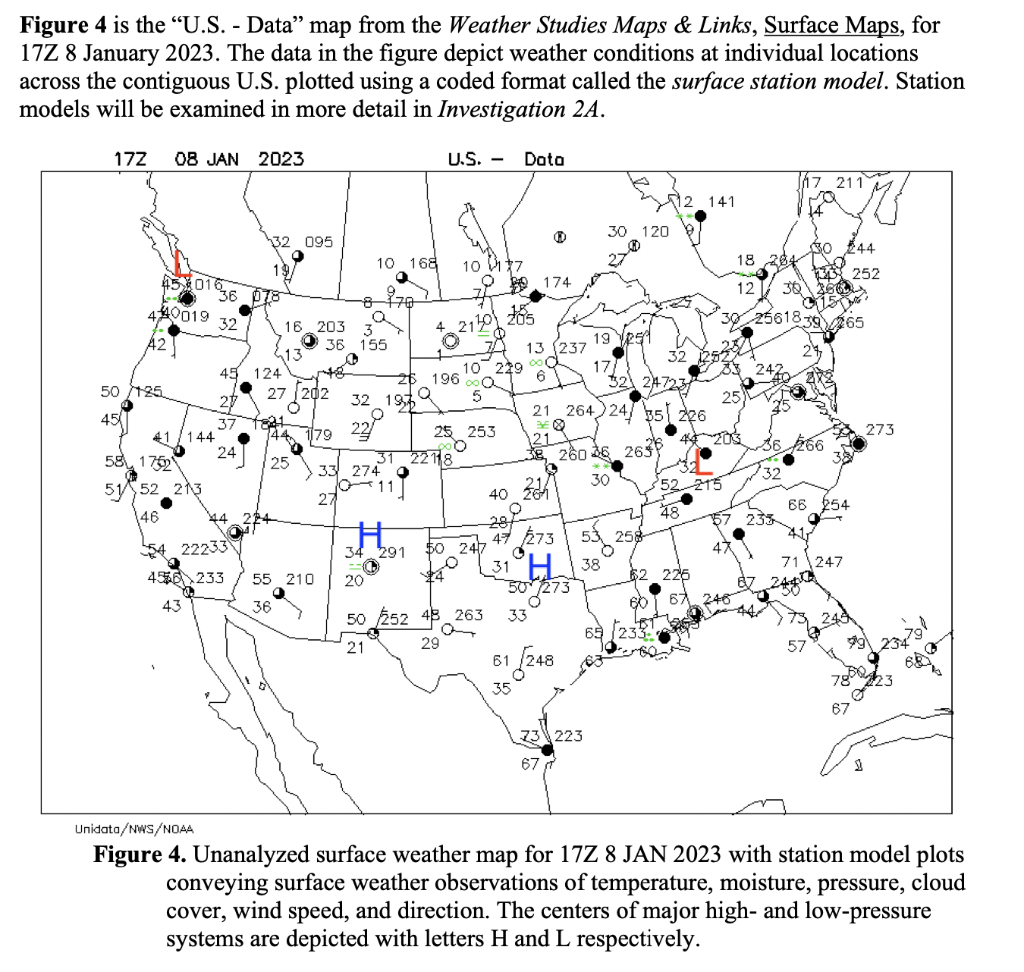
Figure 4 is the "U.S. - Data" map from the Weather Studies Maps \& Links, Surface Maps, for January 2023 . The data in the figure depict weather conditions at individual locations across the contiguous U.S. plotted using a coded format called the surface station model. Station models will be examined in more detail in Investigation . Figure 4. Unanalyzed surface weather map for JAN 2023 with station model plots conveying surface weather observations of temperature, moisture, pressure, cloud cover, wind speed, and direction. The centers of major high- and low-pressure systems are depicted with letters and respectively.
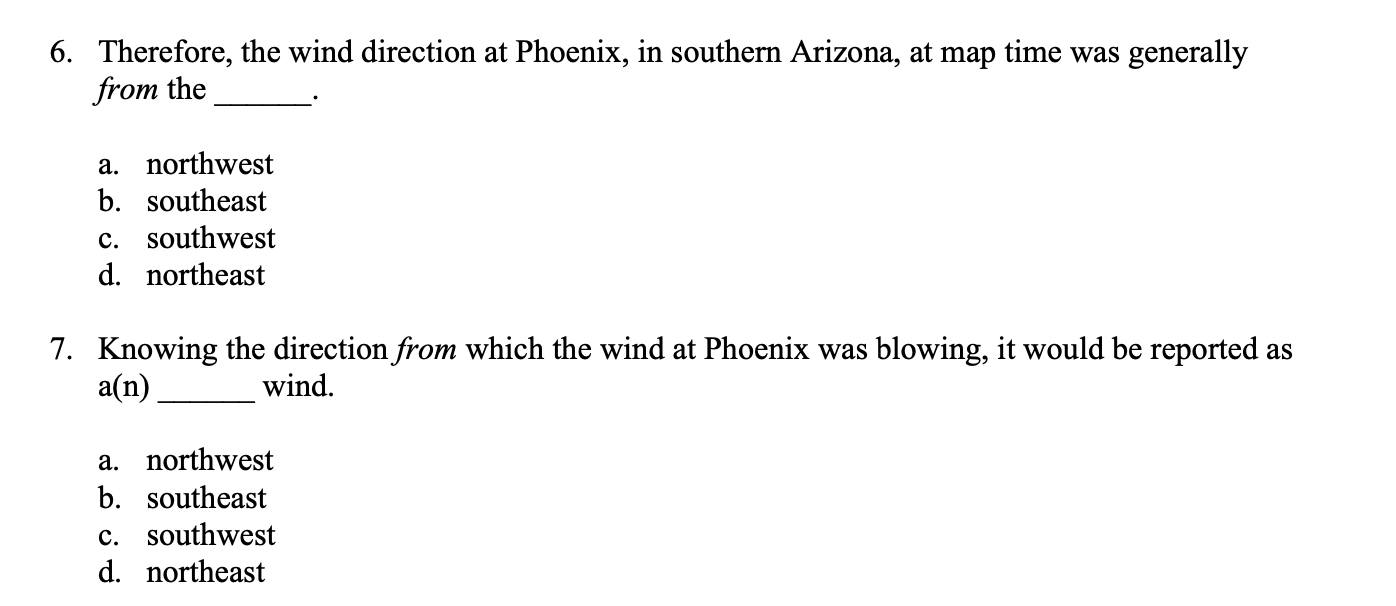
6. Therefore, the wind direction at Phoenix, in southern Arizona, at map time was generally from the a. northwest b. southeast c. southwest d. northeast 7. Knowing the direction from which the wind at Phoenix was blowing, it would be reported as wind. a. northwest b. southeast c. southwest d. northeast
Expert Answer
Very differentThe isobar pattern for the NE part of US com


