Home /
Expert Answers /
Electrical Engineering /
power-system-analysis-1-a-single-line-diagram-of-a-power-network-is-shown-in-the-figure-below-pa496
(Solved): Power System Analysis: 1. A single line diagram of a power network is shown in the figure below. ...
Power System Analysis:
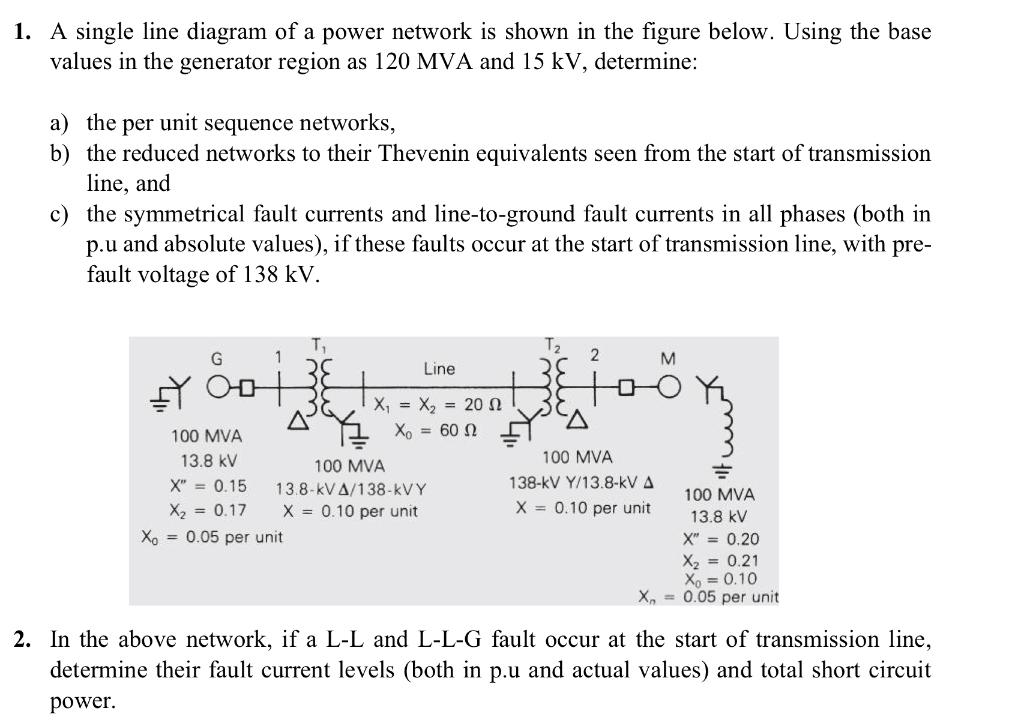
1. A single line diagram of a power network is shown in the figure below. Using the base values in the generator region as \( 120 \mathrm{MVA} \) and \( 15 \mathrm{kV} \), determine: a) the per unit sequence networks, b) the reduced networks to their Thevenin equivalents seen from the start of transmission line, and c) the symmetrical fault currents and line-to-ground fault currents in all phases (both in p.u and absolute values), if these faults occur at the start of transmission line, with prefault voltage of \( 138 \mathrm{kV} \). 2. In the above network, if a L-L and L-L-G fault occur at the start of transmission line, determine their fault current levels (both in p.u and actual values) and total short circuit power.
