Home /
Expert Answers /
Earth Sciences /
plotted-on-upper-air-maps-are-temperature-c-dewpoint-c-wind-speed-pa917
(Solved): Plotted on upper-air maps are temperature (C), dewpoint (C), wind speed ...

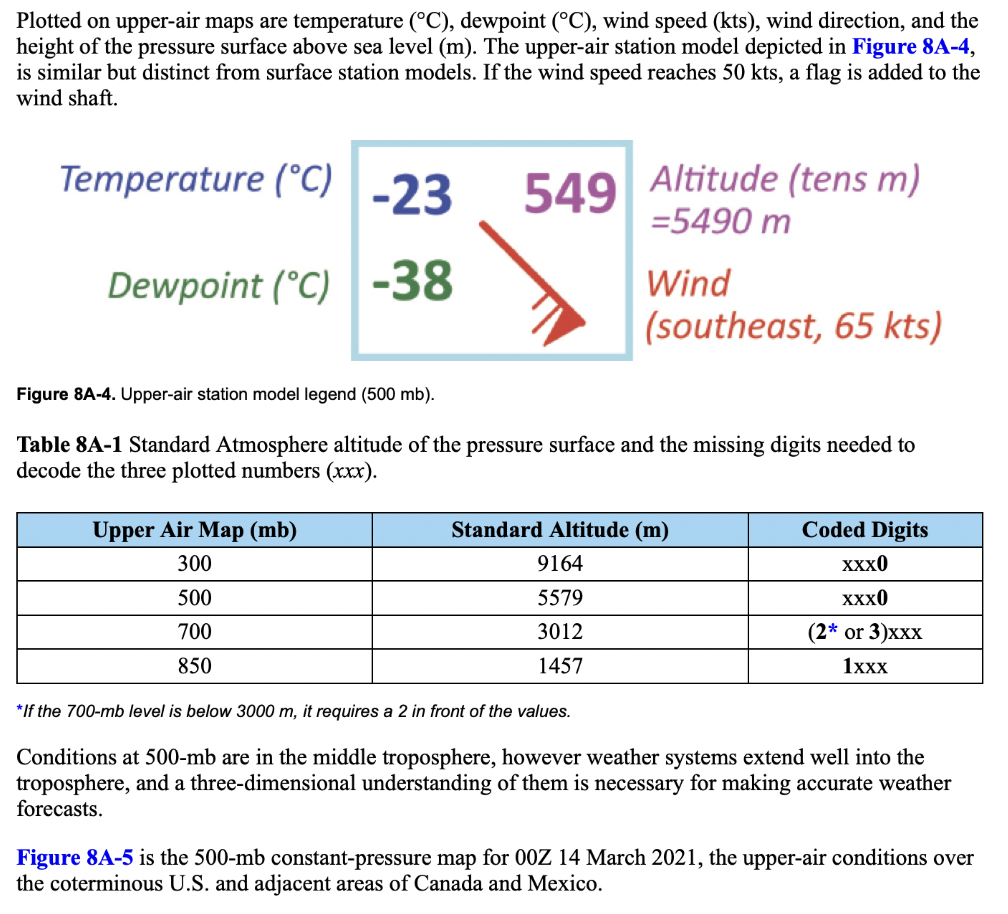
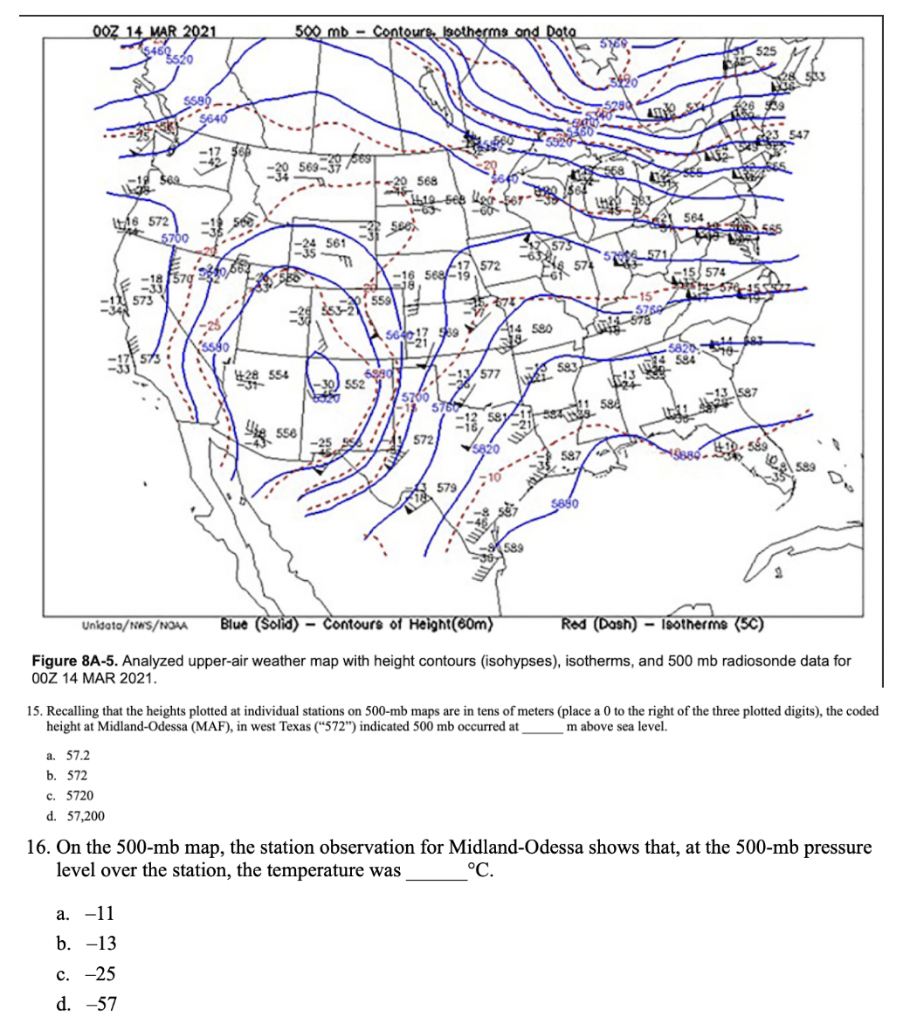
Plotted on upper-air maps are temperature , dewpoint , wind speed , wind direction, and the height of the pressure surface above sea level (m). The upper-air station model depicted in Figure 8A-4, is similar but distinct from surface station models. If the wind speed reaches , a flag is added to the wind shaft. Figure 8A-4. Upper-air station model legend (500 mb). Table 8A-1 Standard Atmosphere altitude of the pressure surface and the missing digits needed to decode the three plotted numbers . *If the 700-mb level is below , it requires a 2 in front of the values. Conditions at 500-mb are in the middle troposphere, however weather systems extend well into the troposphere, and a three-dimensional understanding of them is necessary for making accurate weather forecasts. Figure 8A-5 is the 500-mb constant-pressure map for March 2021, the upper-air conditions over the coterminous U.S. and adjacent areas of Canada and Mexico.
Figure 8A-5. Analyzed upper-air weather map with height contours (isohypses), isotherms, and 500 mb radiosonde data for O0Z 14 MAR 2021. 15. Recalling that the heights plotted at individual stations on 500 -mb maps are in tens of meters (place a 0 to the right of the three plotted digits), the coded height at Midland-Odessa (MAF), in west Texas ("572") indicated occurred at above sea level. a. 57.2 b. 572 c. 5720 d. 57,200 16. On the map, the station observation for Midland-Odessa shows that, at the pressure level over the station, the temperature was . a. -11 b. -13 c. -25 d. -57
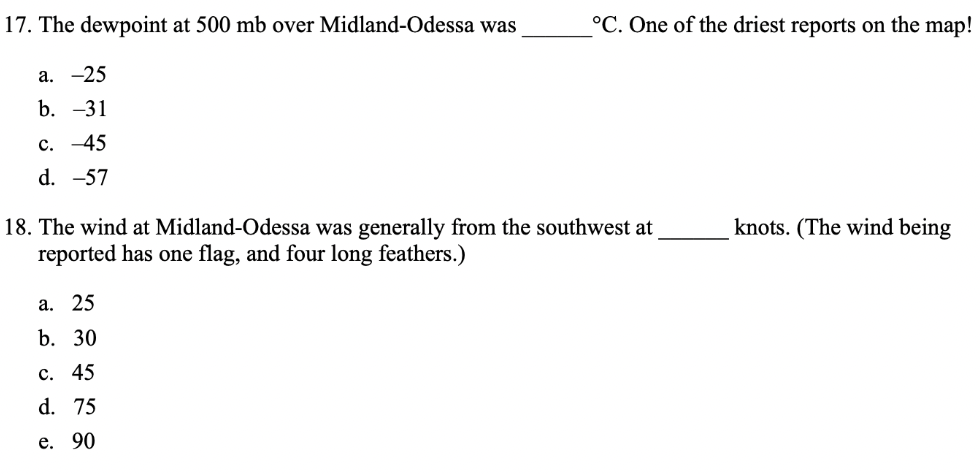
17. The dewpoint at over Midland-Odessa was . One of the driest reports on the map! a. -25 b. -31 c. -45 d. -57 18. The wind at Midland-Odessa was generally from the southwest at knots. (The wind being reported has one flag, and four long feathers.) a. 25 b. 30 c. 45 d. 75 e. 90
Expert Answer
Answer to Q15)The coded height at Midland-Odessa (MAF), in west Texas ("572") indicated 500 mb occurred at 5720 m above sea level. Therefore, the answ

