Home /
Expert Answers /
Chemical Engineering /
please-show-matlab-code-with-explanations-use-3-as-asu-id-drug-delivery-from-a-patch-1-transdermal-pa134
(Solved): Please Show Matlab Code with Explanations! Use 3 as ASU ID Drug delivery from a patch 1 Transdermal ...
Please Show Matlab Code with Explanations! Use 3 as ASU ID


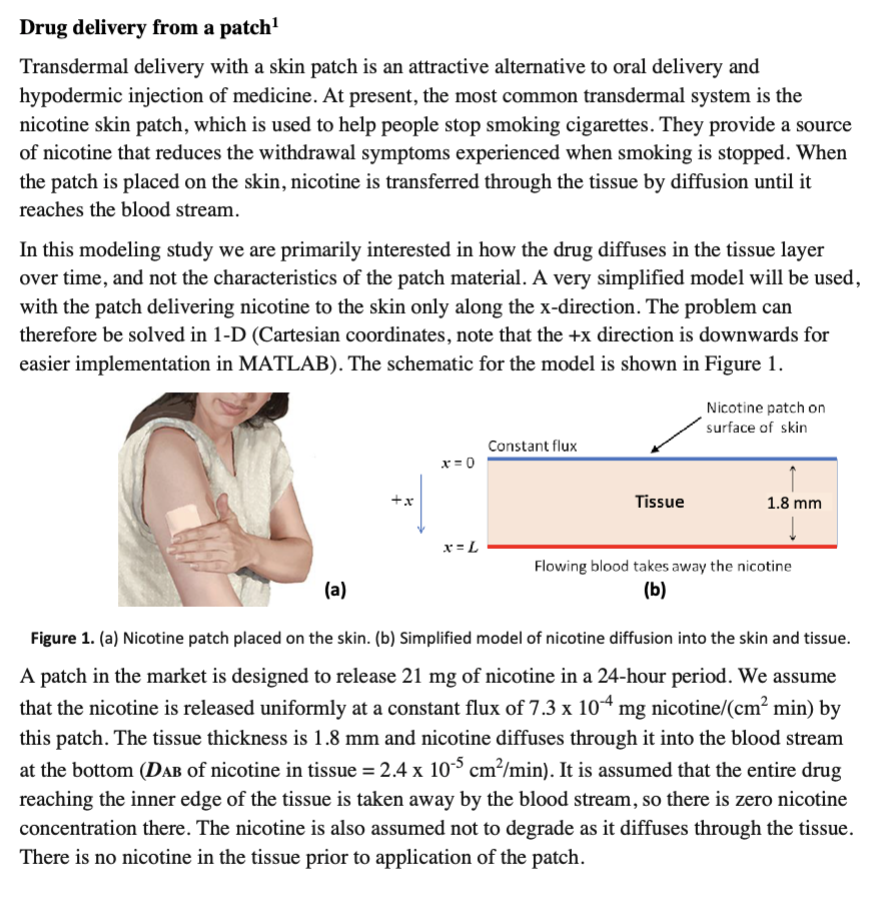
Drug delivery from a patch Transdermal delivery with a skin patch is an attractive alternative to oral delivery and hypodermic injection of medicine. At present, the most common transdermal system is the nicotine skin patch, which is used to help people stop smoking cigarettes. They provide a source of nicotine that reduces the withdrawal symptoms experienced when smoking is stopped. When the patch is placed on the skin, nicotine is transferred through the tissue by diffusion until it reaches the blood stream. In this modeling study we are primarily interested in how the drug diffuses in the tissue layer over time, and not the characteristics of the patch material. A very simplified model will be used, with the patch delivering nicotine to the skin only along the -direction. The problem can therefore be solved in 1-D (Cartesian coordinates, note that the direction is downwards for easier implementation in MATLAB). The schematic for the model is shown in Figure 1. a) Figure 1. (a) Nicotine patch placed on the skin. (b) Simplified model of nicotine diffusion into the skin and tissue. A patch in the market is designed to release of nicotine in a 24-hour period. We assume that the nicotine is released uniformly at a constant flux of nicotine by this patch. The tissue thickness is and nicotine diffuses through it into the blood stream at the bottom of nicotine in tissue . It is assumed that the entire drug reaching the inner edge of the tissue is taken away by the blood stream, so there is zero nicotine concentration there. The nicotine is also assumed not to degrade as it diffuses through the tissue. There is no nicotine in the tissue prior to application of the patch.
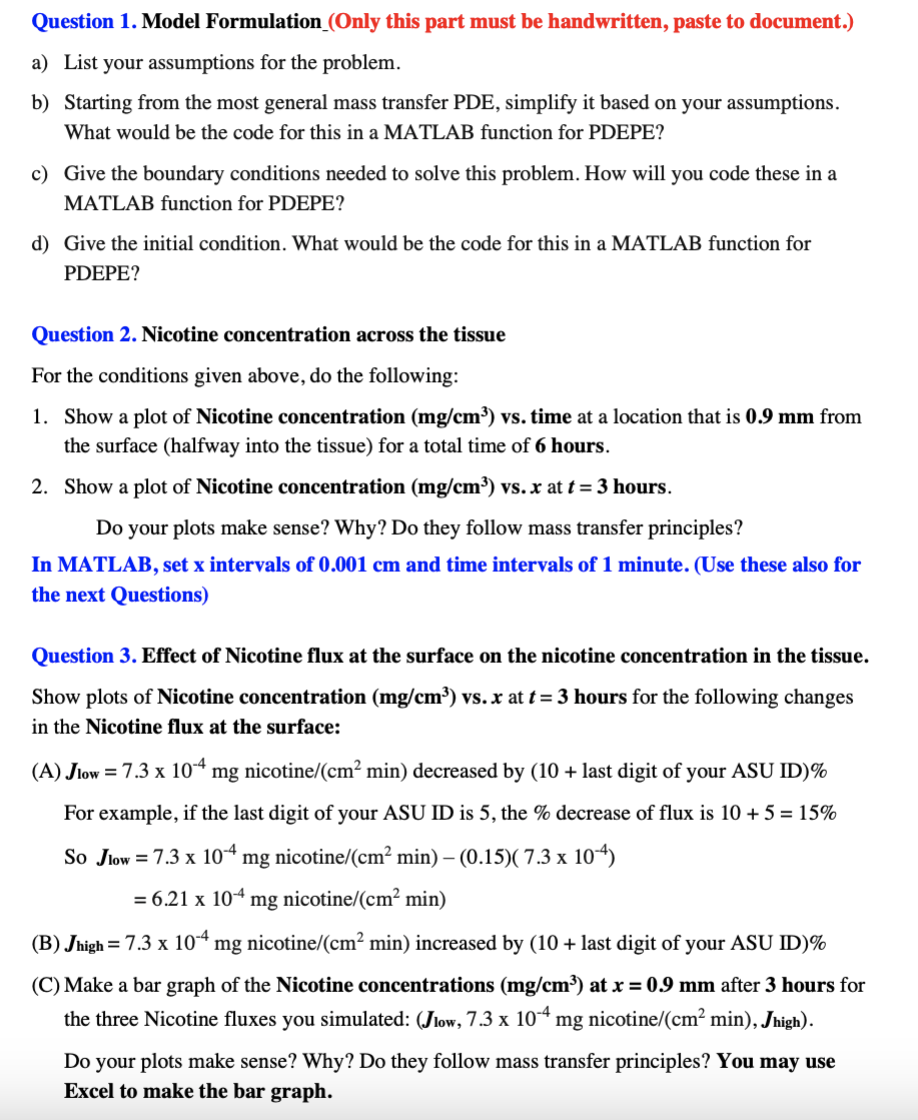
Question 1. Model Formulation_(Only this part must be handwritten, paste to document.) a) List your assumptions for the problem. b) Starting from the most general mass transfer PDE, simplify it based on your assumptions. What would be the code for this in a MATLAB function for PDEPE? c) Give the boundary conditions needed to solve this problem. How will you code these in a MATLAB function for PDEPE? d) Give the initial condition. What would be the code for this in a MATLAB function for PDEPE? Question 2. Nicotine concentration across the tissue For the conditions given above, do the following: 1. Show a plot of Nicotine concentration vs. time at a location that is from the surface (halfway into the tissue) for a total time of 6 hours. 2. Show a plot of Nicotine concentration vs. at hours. Do your plots make sense? Why? Do they follow mass transfer principles? In MATLAB, set intervals of and time intervals of 1 minute. (Use these also for the next Questions) Question 3. Effect of Nicotine flux at the surface on the nicotine concentration in the tissue. Show plots of Nicotine concentration vs. at hours for the following changes in the Nicotine flux at the surface: (A) nicotine decreased by last digit of your ASU ID) For example, if the last digit of your ASU ID is 5 , the decrease of flux is So nicotine (B) nicotine increased by last digit of your ASU ID (C) Make a bar graph of the Nicotine concentrations at after 3 hours for the three Nicotine fluxes you simulated: nicotine . Do your plots make sense? Why? Do they follow mass transfer principles? You may use Excel to make the bar graph.
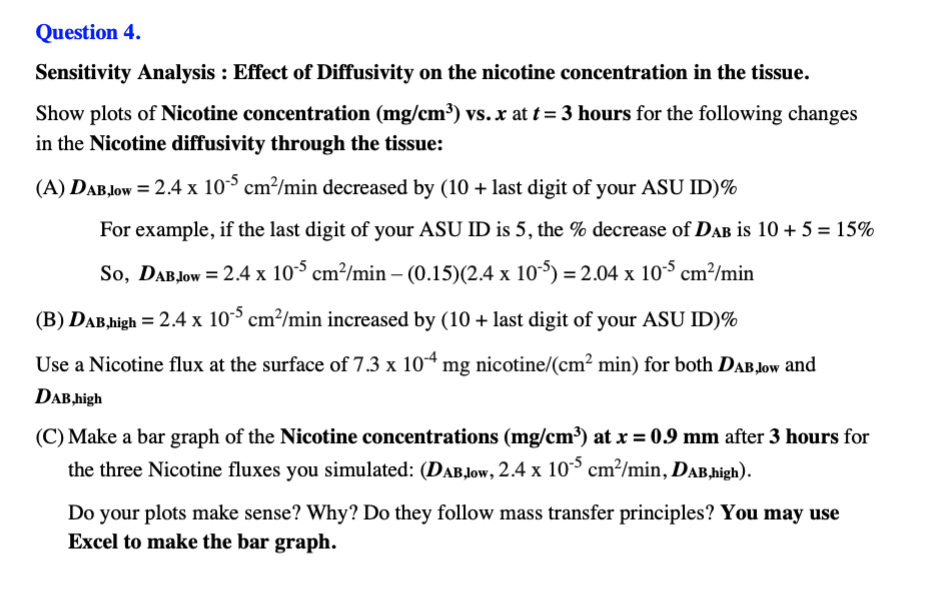
Sensitivity Analysis : Effect of Diffusivity on the nicotine concentration in the tissue. Show plots of Nicotine concentration vs. at hours for the following changes in the Nicotine diffusivity through the tissue: (A) decreased by last digit of your ASU ID) For example, if the last digit of your ASU ID is 5, the \% decrease of is So, (B) increased by last digit of your ASU ID) Use a Nicotine flux at the surface of nicotine for both and (C) Make a bar graph of the Nicotine concentrations at after 3 hours for the three Nicotine fluxes you simulated: . Do your plots make sense? Why? Do they follow mass transfer principles? You may use Excel to make the bar graph.