Home /
Expert Answers /
Statistics and Probability /
please-show-all-steps-i-am-confused-ugh-nbsp-the-pass-completion-percentages-of-10-college-footbal-pa223
(Solved): PLEASE SHOW ALL STEPS I AM CONFUSED UGH The pass completion percentages of 10 college footbal ...
PLEASE SHOW ALL STEPS I AM CONFUSED UGH
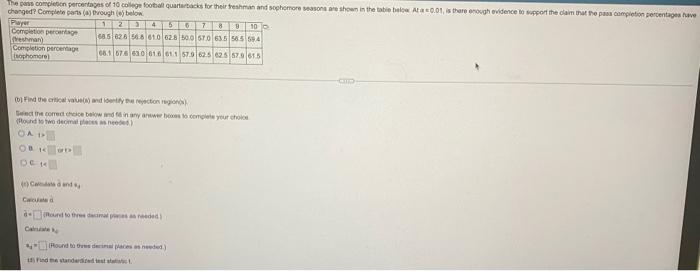


The pass completion percentages of 10 college football quarterbacks for their freshman and sophomore seasons are shown in the table below At a 0.01, is there enough evidence to support the claim that the pass completion percentages have changed? Complete parts (a) through (e) below 9 10 > 1234 5 6 7 8 685 626 546 61.0 62.8 50.0 67.0 63.5 56.5 594 68.1 576 630 616 611 57.9 625 625 57.961.5 Player Completion percentage reshman) Completion percentage sophomore) (b) Find the critical value(s) and identify the rejection region) Select the correct choice below and fd in any answer boxes to complete your choice (Round to two decimal places as needed) CA D COB K @D De t (1) Caldas d and Calculated Cal (Round to three decimal pieces as needed) (Round to the decimal places as needed) 1) Find the standardized test statist
The pass completion percentages of 10 college football quarterbacks for their freshman and sophomore seasons are shown in the table below At a 0.01, is there enough evidence to support the claim that the pass completion percentages have Complete parts (a) through (e) below. changed? Player Completion percentage reshman) Completion percentage (sophomore) (b) Find the critical value(s) and identify the rejection regions) Select the correct choice below and f in any answer boxes to complete your choos (Round to two decimal places as needed) OA D OF R @D (1) Caldas d and s Cacuated 234 5 6 7 8 910 68.5 626 56.8 61.0 628 50.0 67.0 63.5 56.5 59.4 68.1 676 630 61.6 611 57.9 625 625 57.961.5 Cale Round to three decimal pieces as needed) (Round to tives decimal places as needed) Find the standardized test atata t
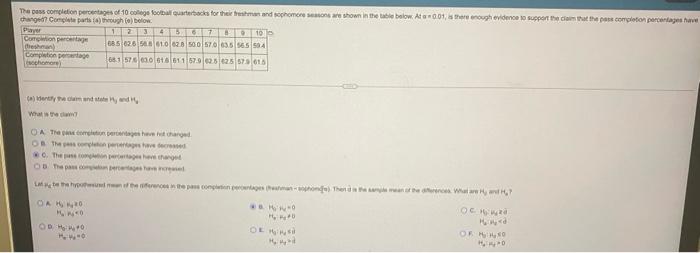
The pass completion percentages of 10 college football quarterbacks for their treshman and sophomore seasons are shown in the table below. At a 0.01, is there enough evidence to support the claim that the pass completion percentages have changed? Complete parts (a) through (e) below Player Completion percentage reshman) Completion percentage sophomore) 346 810 685 626 588 610 628 500 57.0 63.5 56.5 504 681 576 630 616 611 67.9 625 625 579615 (a) Identify the claim and state Hy and H, What is the da OA The pas completion percentages have hit changed OB The peas completion percentages have decreased C. The pase completion percentages have changed OB The pass congielun percentages have increased Lat be the hypothed men of the differences in the pass completion percentages (heaman-sphonde). Then d is the same mean of the differences. What are H, and ?7 OCH CA 240 29420 224 ?0 OF IND Mynd OF 150 1120
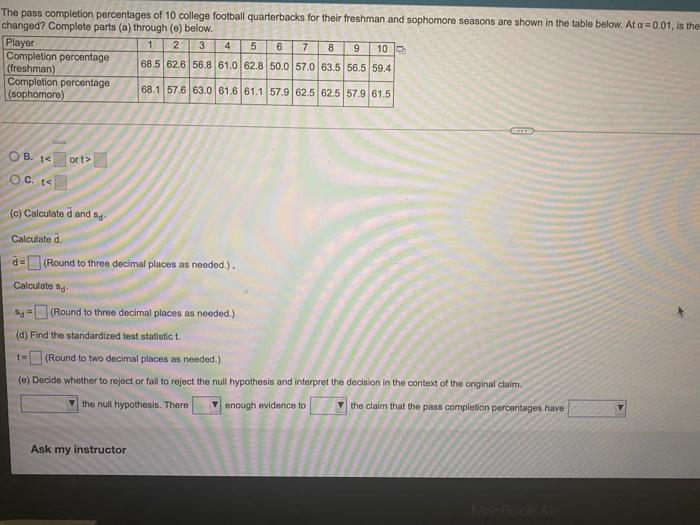
The pass completion percentages of 10 college football quarterbacks for their freshman and sophomore seasons are shown in the table below. At a=0.01, is the changed? Complete parts (a) through (e) below. Player 1 3 4 5 6 7 8 9 10 2 68.5 62.6 56.8 61.0 62.8 50.0 57.0 63.5 56.5 59.4 68.1 57.6 63.0 61.6 61.1 57.9 62.5 62.5 57.9 61.5 Completion percentage (freshman) Completion percentage (sophomore) OB. 1 O.C. 1< ort> (c) Calculated and s- Calculate d. d=(Round to three decimal places as needed.), Calculate - I = (Round to three decimal places as needed.) (d) Find the standardized test statistic t. 1= (Round to two decimal places as needed.) (e) Decide whether to reject or fail to reject the null hypothesis and interpret the decision in the context of the original claim. the null hypothesis. There enough evidence to the claim that the pass completion percentages have Ask my instructor
The pass completion percentages of 10 college football quarterbacks for their treshman and sophomore seasons are shown in the table below At a 0.01, is there enough evidence to support the claim that the pass completion percentages have changed? Complete parts (a) through (e) below. Player Completion percentage dreshman) Completion percentage sophomore) 345 6910 685 626 588 61.0 628 500 57.0 63.5 56.5 59.4 68.1 576 630 616 611 67.9 625 625 579615 (a) Identify the claim and state Hy and H What is the ca OA The pas completion percentages have hit changed OB The pas completion percentages have decreased C. The pase completion percentages have changed OB The pass cogien percentages have increased La be the hyped men of the differences in the pass completion percentages (hahman-sphonde) Then d is the sample mean of the differences. What are Hand? Oca ?? ?? 240 OD 14 1²24 M?0 OF IGNE H OF 41450 1120