Home /
Expert Answers /
Chemistry /
please-help-the-graph-shows-the-hormone-binding-specificity-of-a-hypothetical-membrane-receptor-the-pa144
(Solved): please help The graph shows the hormone-binding specificity of a hypothetical membrane receptor. The ...
please help
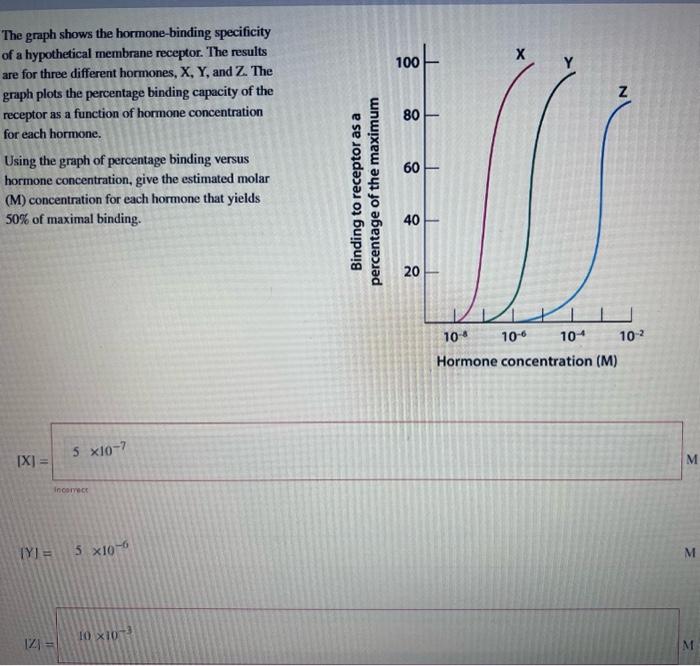
The graph shows the hormone-binding specificity of a hypothetical membrane receptor. The results are for three different hormones, X, Y, and Z. The graph plots the percentage binding capacity of the receptor as a function of hormone concentration for each hormone. Using the graph of percentage binding versus hormone concentration, give the estimated molar (M) concentration for each hormone that yields \( 50 \% \) of maximal binding. \[ |Y|=5 \times 10^{-6} \]