Home /
Expert Answers /
Operations Management /
please-help-me-solve-this-starbucks-has-a-large-global-supply-chain-that-must-efficiently-supply-ov-pa955
(Solved): Please help me solve this Starbucks has a large, global supply chain that must efficiently supply ov ...
Please help me solve this
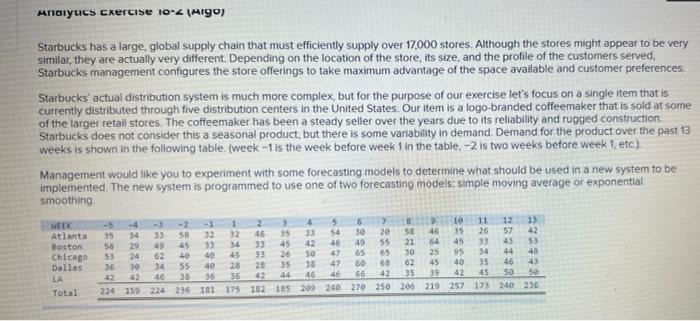
Starbucks has a large, global supply chain that must efficiently supply over 17,000 stores. Although the stores might appear to be very similar, they are actually very different. Depending on the location of the store, its size, and the profile of the customers served, Starbucks management configures the store offerings to take maximum advantage of the space available and customer preferences: Starbucks' actual distribution system is much more complex, but for the purpose of our exercise let's focus on a single item that is currently distributed through five distribution centers in the United States. Our item is a logo-branded coffeemaker that is sold at some of the larger retail stores. The coffeemaker has been a steady seller over the years due to its reliability and rugged construction. Starbucks does not consider this a seasonal product, but there is some variability in demand. Demand for the product over the past 13 weeks is shown in the following table. (week \( -1 \) is the week before week 1 in the table, \( -2 \) is two weeks before week 1 , etc). Management would like you to experiment with some forecasting models to determine what should be used in a new system to be implemented. The new system is programmed to use one of two forecasting models: simple moving average or exponential smoothing.
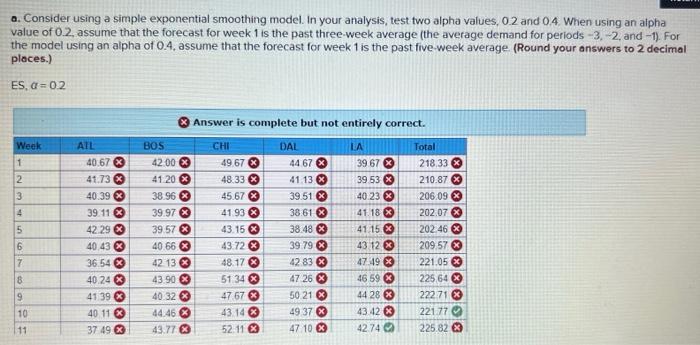
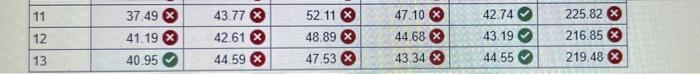
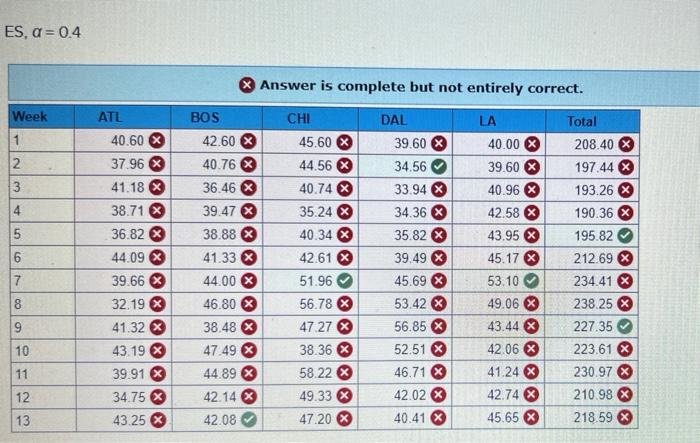
a. Consider using a simple exponential smoothing model. In your analysis, test two alpha values, \( 0.2 \) and \( 0.4 \). When using an alpha value of \( 0.2 \), assume that the forecast for week 1 is the past three-week average (the average demand for periods \( -3,-2 \), and \( -1 \) ). For the model using an alpha of \( 0.4 \), assume that the forecast for week 1 is the past five-week average (Round your answers to 2 decimal places.) \( \mathrm{ES}, \alpha=0.2 \)
\( \alpha=0.4 \)
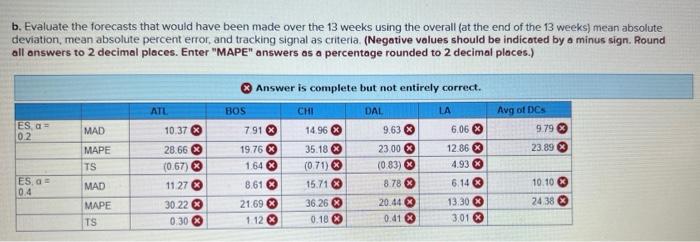
b. Evaluate the forecasts that would have been made over the 13 weeks using the overall (at the end of the 13 weeks) mean absolute deviation, mean absolute percent error, and tracking signal as criteria. (Negative values should be indicated by a minus sign. Round all answers to 2 decimal places. Enter "MAPE" answers as a percentage rounded to 2 decimal places.)
Expert Answer
Here, as per the given data, we can have the 3-week and 5-week moving average forecast analysis as follows: Formulas used: Error = Actual Demand - For