Home /
Expert Answers /
Chemistry /
please-help-finish-chart-rt-using-spectrophotometry-to-determine-an-equilibrium-co-report-q-pa801
(Solved): please help finish chart rt - Using Spectrophotometry to Determine an Equilibrium Co... REPORT \( \q ...
please help finish chart
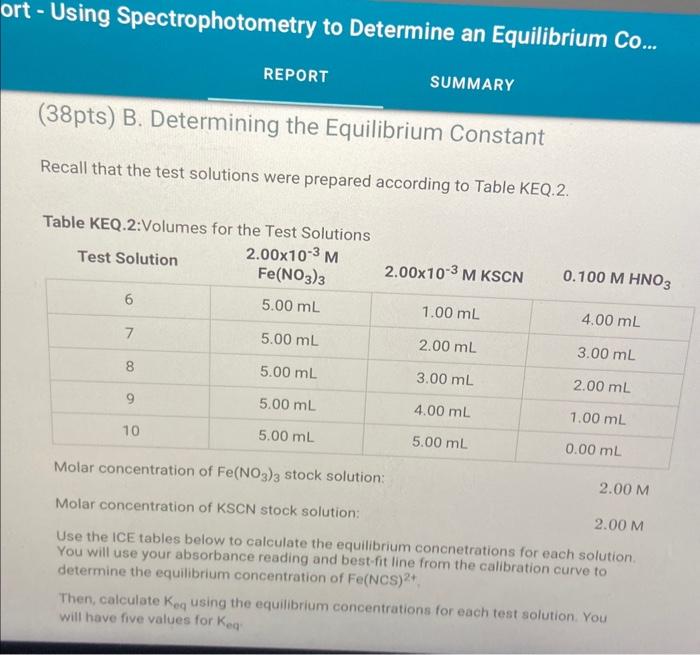
rt - Using Spectrophotometry to Determine an Equilibrium Co... REPORT \( \quad \) SUMMARY (38pts) B. Determining the Equilibrium Constant Recall that the test solutions were prepared according to Table KEQ.2. Molar concentration of \( \mathrm{Fe}\left(\mathrm{NO}_{3}\right)_{3} \) stock solution: \( 2.00 \mathrm{M} \) Molar concentration of KSCN stock solution: \( 2.00 \mathrm{M} \) Use the ICE tables below to calculate the equilibrium concnetrations for each solution. You will use your absorbance reading and best-fit line from the calibration curve to determine the equilibrium concentration of Fe(NCS) \( { }^{2+} \) Then, calculate \( K_{\text {eq }} \) using the equilibrium concentrations for each test solution. You will have five values for \( K_{\text {eq }} \)
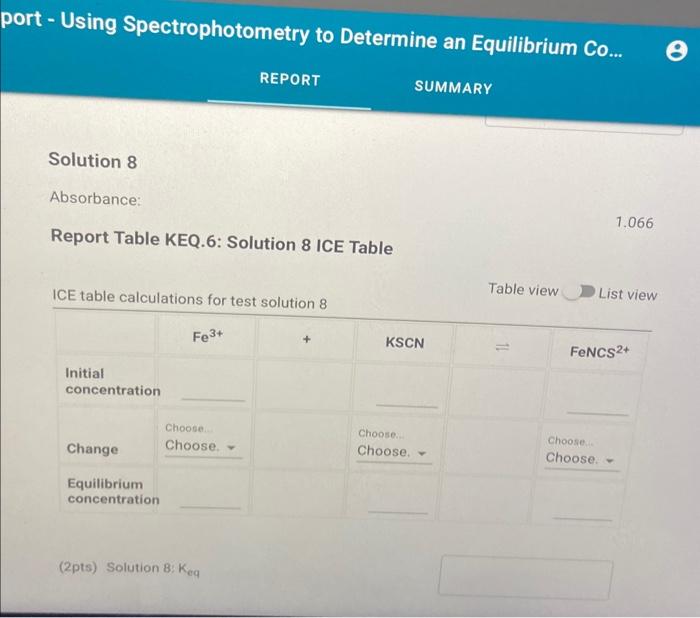
jort - Using Spectrophotometry to Determine an Equilibrium Co... REPORT SUMMARY Solution 8 Absorbance: \( 1.066 \) Report Table KEQ.6: Solution 8 ICE Table ICE table calculations for test solution \& Table view D List view (2pts) Solution B: \( K_{\text {eq }} \)