Home /
Expert Answers /
Economics /
please-help-6-determinants-of-demand-the-following-graph-input-tool-shows-the-demand-for-sedans-i-pa574
(Solved): please help!! 6. Determinants of demand The following graph input tool shows the demand for sedans i ...
please help!!
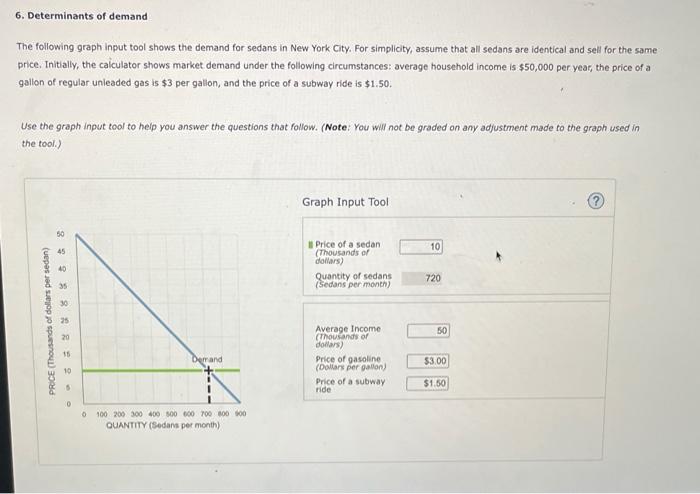
6. Determinants of demand The following graph input tool shows the demand for sedans in New York City. For simplicity, assume that all sedans are identical and sell for the same price. Initially, the calculator shows market demand under the following circumstances: average household income is \( \$ 50,000 \) per year, the price of a gallon of regular unleaded gas is \( \$ 3 \) per gallion, and the price of a subway ride is \( \$ 1.50 \). Use the graph input tool to help you answer the questions that follow. (Note: You will not be graded on any adjustment made to the graph used in the tool.) Graph Input Tool
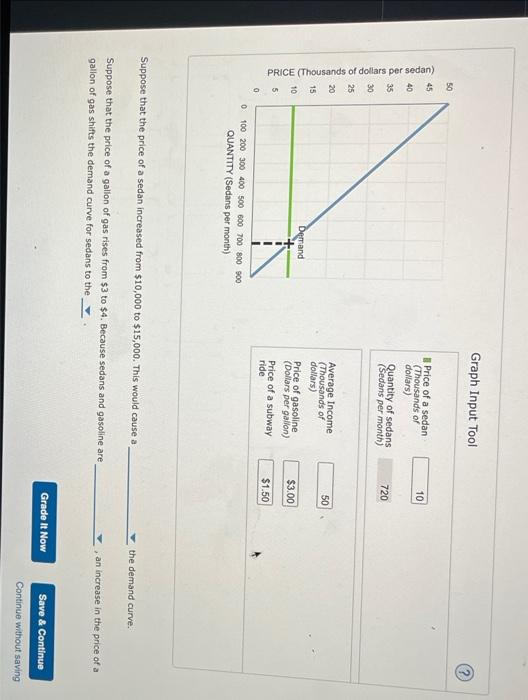
Graph Input Tool \& Price of a sedan (Thousands of dollars) Quantity of sedans (Sedans per month) Average income (Thousands of dollars) Price of gasoline (Dollars per gailion) Price of a subway ride Suppose that the price of a sedan increased from \( \$ 10,000 \) to \( \$ 15,000 \). This would cause a the demand curve. Suppose that the price of a galion of gas rises from \( \$ 3 \) to \( \$ 4 \). Because sedans and gasoline are gallon of gas shifts the demand curve for sedans to the
Expert Answer
This topic Determinants of Demand The price of the good or