Home /
Expert Answers /
Economics /
please-fill-out-all-blanks-and-show-how-to-do-all-graphs-6-deriving-the-short-run-supply-curve-th-pa644
(Solved): please fill out all blanks and show how to do ALL graphs. 6. Deriving the short-run supply curve Th ...
please fill out all blanks and show how to do ALL graphs.
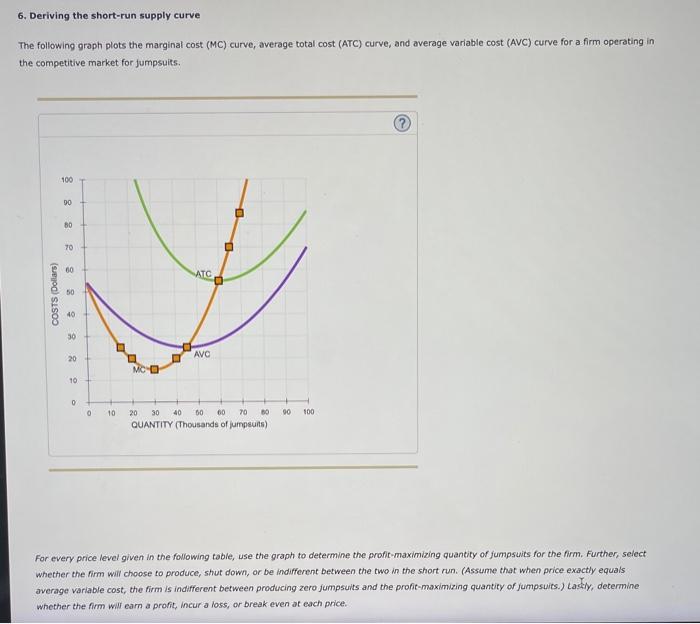
6. Deriving the short-run supply curve The following graph plots the marginal cost (MC) curve, average total cost (ATC) curve, and average variable cost (AvC) curve for a firm operating in the competitive market for jumpsuits. For every price level given in the following table, use the graph to determine the profit-maximizing quantity or fumpsuits for the firm. Further, select whether the firm will choose to produce, shut down, or be indifferent between the two in the short run. (Assume that when price exactly equais average variable cost, the firm is indifferent between producing zero jumpsuits and the profit-maximizing quantity of jumpsuits.) Lastly, determine whether the firm wilf earn a profit, incur a loss, or break even at each price.
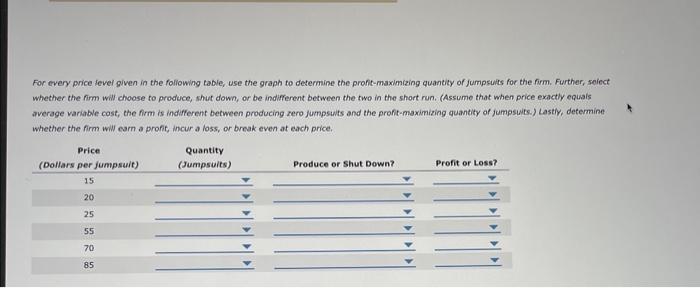
For every price fevel given in the following table, use the graph to determine the profit-maximizing quantity of jumpsuits for the firm. Further, seiect whether the rimm will choose to produce, shut down, or be indiferent between the two in the short run. (Assume that when price exactly equais average variable cost, the firm is indifferent between producing rero fumpsuits and the profit-maximizing quantity of jumpswits.) Lastiy, determine whether the firm wiW earn a profit, incur a loss, or break even at each price.
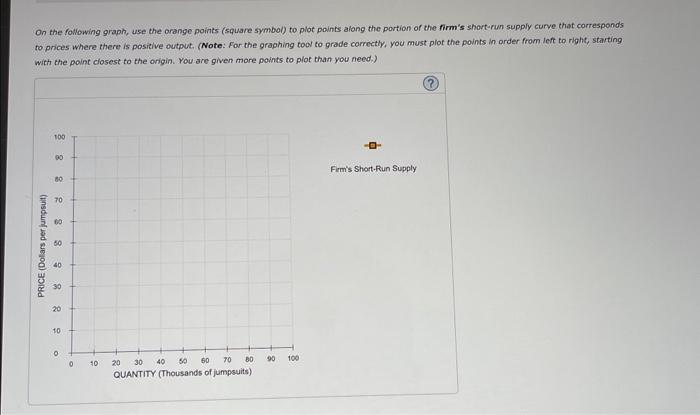
On the following graph, use the orange points (square symbol) to plot points along the portion of the firm's short-run supply curve that corresponds to prices where there is positive output. (Note: For the graphing toov to grade correctly, you must plot the points in order from left to right, starting with the polnt closest to the origin. You ane given more points to plot than you need.)
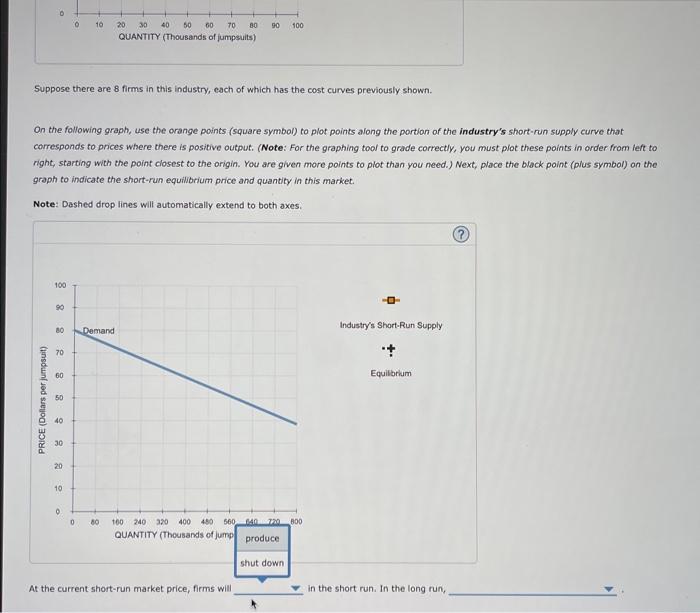
Suppose there are 8 firms in this industry, each of which has the cost curves previously shown. On the following graph, use the orange points (square symbol) to plot points along the portion of the industry's short-run supply curve that corresponds to prices where there is positive output. (Note: For the graphing tool to grade correctly, you must plot these points in order from left to right, starting with the point closest to the origin. You are given more points to plot than you need.) Next, place the black point (plus symbol) on the graph to indicate the short-run equilibrium price and quantity in this market. Note: Dashed drop lines will automatically extend to both axes.