Home /
Expert Answers /
Economics /
please-draw-and-fill-in-the-blanks-nbsp-consider-the-competitive-market-for-sports-jackets-the-fo-pa852
(Solved): Please draw and fill in the blanks. Consider the competitive market for sports jackets. The fo ...
Please draw and fill in the blanks.
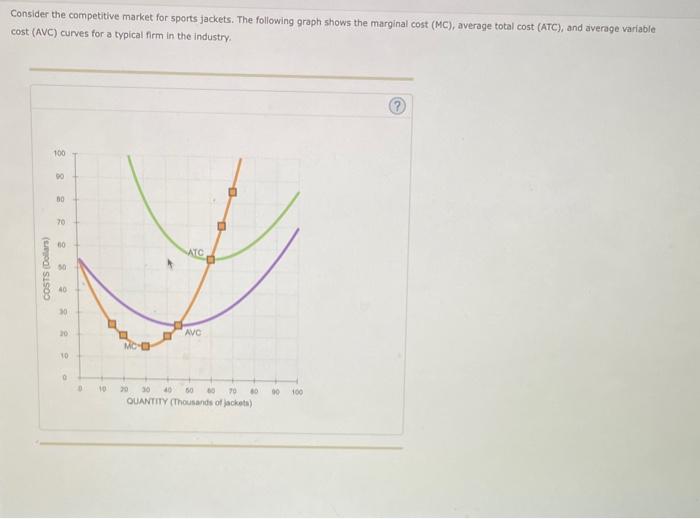
Consider the competitive market for sports jackets. The following graph shows the marginal cost (MC), average total cost (ATC), and average variable cost (AVC) curves for a typical firm in the industry.
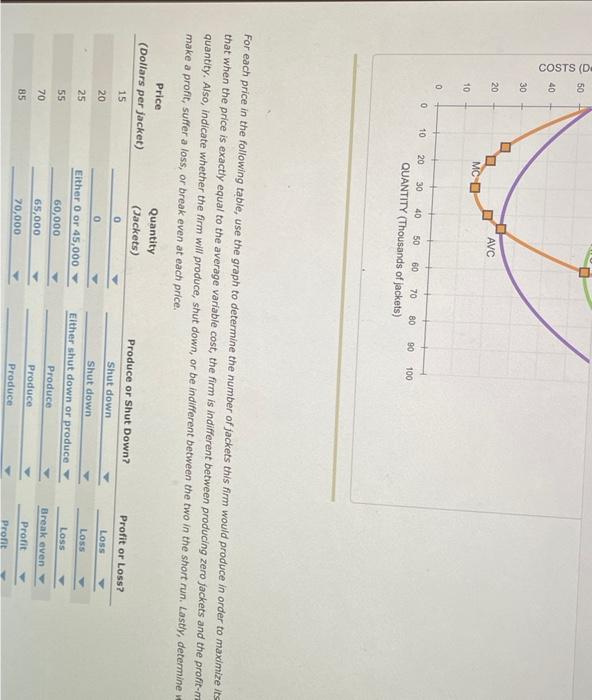
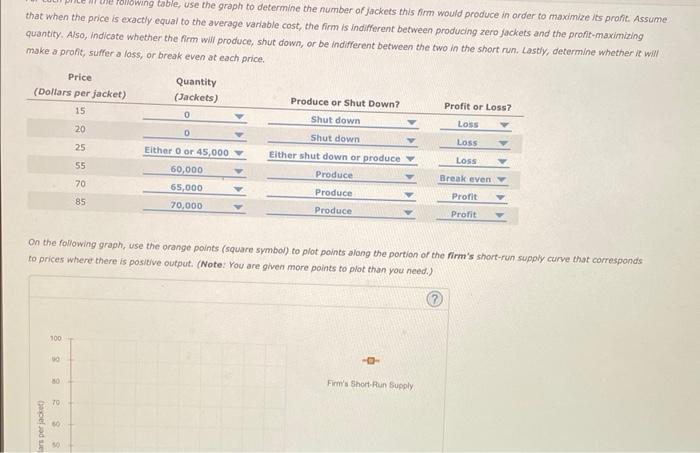
For each price in the following table, use the graph to determine the number of jackets this firm would produce in order to maximize its that when the price is exactly equal to the average variable cost, the firm is indifferent between producing zero jackets and the profit-n quantity. Also, indicate whether the firm will produce, shut down, or be indifferent between the two in the short run. Lastly, determine make a profit, suffer a loss, or break even at each price.
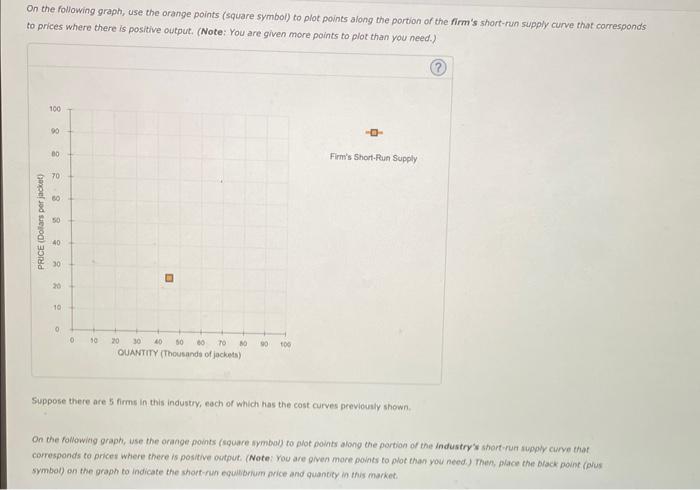
make a profit, suffer a loss, or break even at each orice. make a pront, suifer a lass, or break even at each price. On the following graph, use the orange points (square symbol) to plot points along the portion of the firm's short-run supply curve that comesponds to prices where there is positive output. (Note: You are given more points to plot than you need.)
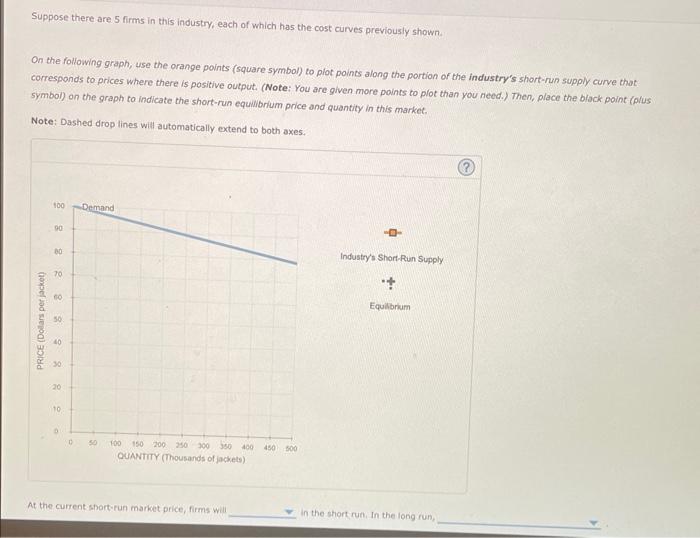
On the following graph, use the orange points (square symbol) to plot points along the portion of the firm's short-run supply curve that carresponds to prices where there is positive output. (Note: You are given more points to plot than you need.) Suppose there are 5 firms in this industry, each of which has the cost curves peeviously shown. On the followitig graph, use the orange points (cquare fiymbol) fo plot points along the portion of the industry's short-runt suppiy curve that corresponds to prices where there is positive output, (Note: You are given more points to plot than you need.) Then, place the black point (arus symbal) on the graph to indicate the shopt-run equifibrium orice and quanticy in this market:
Suppose there are 5 firms in this industry, each of which has the cost curves previously shown. On the following graph, use the orange points (square symbol) to plot points along the portion of the industry's short-run supply curve that correspands to prices where there is positive output. (Note: You are given more points to plot than you need.) Then, place the black point (plus symbol) on the graph to indicate the short-run equilibrium price and quantity in this market. Note: Dashed drop lines will automatically extend to both axes. At the current short-tun market price, firms will in the short run. In the long run,
Expert Answer
Serious firm economic situation: • The serious firm delivering monetary benefit in lengthy run, when the cost is higher than the typical absolute expe