Home /
Expert Answers /
Economics /
please-do-all-parts-including-the-graphing-too-thank-you-3-the-market-for-electronic-textbooks-pa360
(Solved): Please do all parts, including the graphing too, thank you! 3. The market for electronic textbooks ...
Please do all parts, including the graphing too, thank you!
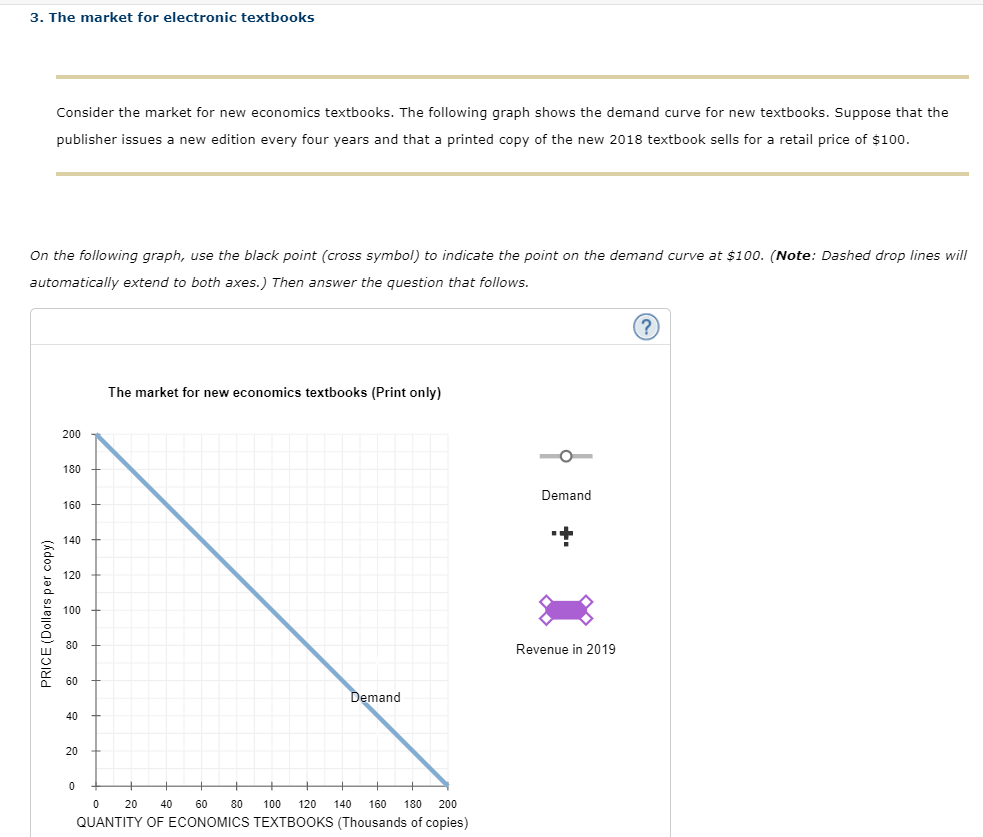
3. The market for electronic textbooks Consider the market for new economics textbooks. The following graph shows the demand curve for new textbooks. Suppose that the publisher issues a new edition every four years and that a printed copy of the new 2018 textbook sells for a retail price of \( \$ 100 \). On the following graph, use the black point (cross symbol) to indicate the point on the demand curve at \( \$ 100 \). (Note: Dashed drop lines will automatically extend to both axes.) Then answer the question that follows.
In 2018 , at \( \$ 100 \), copies of the textbook are demanded, and the publisher's revenue is Suppose that in the early part of a new book's life, sales drop by \( 15 \% \) to \( 20 \% \) each term, as the pool of used books on the market grows. This is because after being on the market, the latest edition of a given textbook will have made its way into the used textbook market, giving many students the opportunity to move from new textbooks toward used ones. As the supply of used textbooks increases, the price of used textbooks decreases, and thus the expected resale value for new textbooks declines. Suppose the publisher still plans to charge the same price of \( \$ 100 \) per new copy of the textbook between editions. and drag the curve to the desired position. The curve will snap into position, so if you try to move a curve and it snaps back to its orition, the desired position. To see the area of the rectangle, select the shaded region.) Then answer the question that foll In 2019, at \( \$ 100, \quad \) copies of textbook will be demanded, and the publisher's expected revenue is Suppose now that the publisher realizes the damaging effect of the market for used textbooks on its revenue. Market resear that on average, between editions, the price of an economics textbook declines by approximately \( 50 \% \). To offset the potential damage to revenue, the publisher decides to sell both the printed textbook at \( \$ 100 \) and an electronic version of the textbook at a competitive price of \( \$ 20 \), which is more than \( 75 \% \) less than the price of a new textbook. By design, e-books offer the same content along with a number of advanced features such as highlighting the text, searching, and bookmarking. To obtain an e-book, students must purchase a personalized access code that absolutely cannot be resold or transferred.
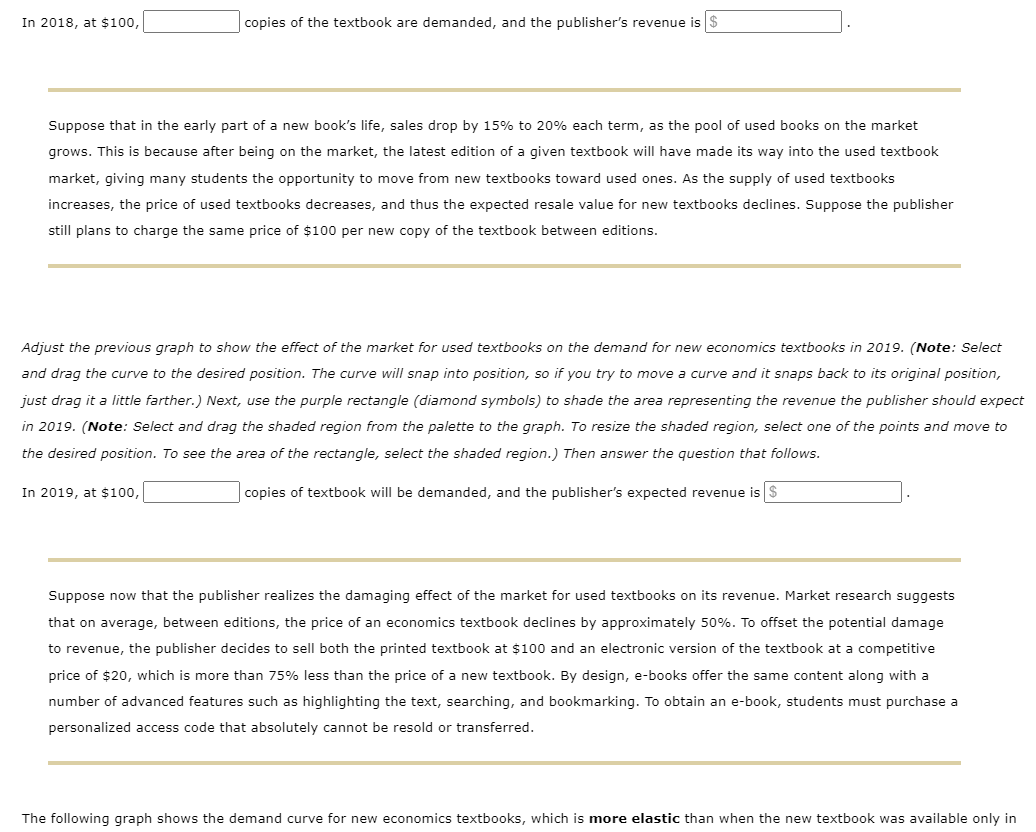
print form (as shown on the previous graph). This is because now the new printed book has a substitute-a new e-book. 2019. Next, use the green rectangle (triangle symbols) to shade the area representing the revenue the publisher should expect by offing the books in 2019. Then answer the question that follows. (?) By offering e-books at \( \$ 20 \), the publisher will sell copies of e-books and generate in revenue. At the same time, copies of new printed textbooks will be sold, which will generate in revenue.
Expert Answer
In 2018, at $100, 100000 copies of textbooks will be demanded and and the publisher's expected revenue is $10000000. (Revenue= Quantity*