Home /
Expert Answers /
Electrical Engineering /
please-comment-to-explain-sections-of-the-matlab-code-for-better-understanding-please-objective-in-pa120
(Solved): please comment to explain sections of the matlab code for better understanding please OBJECTIVE: In ...

please comment to explain sections of the matlab code for better understanding please
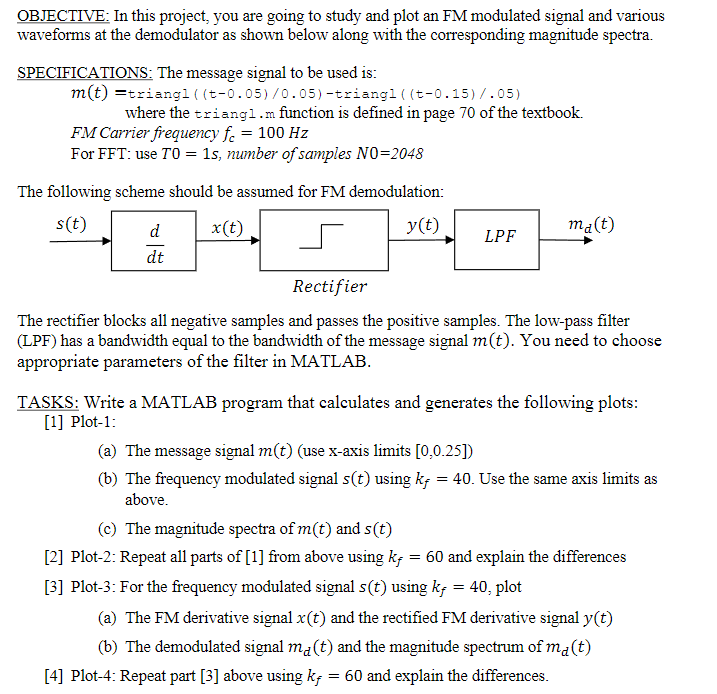
OBJECTIVE: In this project, you are going to study and plot an FM modulated signal and various waveforms at the demodulator as shown below along with the corresponding magnitude spectra. SPECIFICATIONS: The message signal to be used is: where the triangl. function is defined in page 70 of the textbook. FM Carrier frequency For FFT: use s, number of samples The following scheme should be assumed for FM demodulation: The rectifier blocks all negative samples and passes the positive samples. The low-pass filter (LPF) has a bandwidth equal to the bandwidth of the message signal . You need to choose appropriate parameters of the filter in MATLAB. TASKS: Write a MATLAB program that calculates and generates the following plots: [1] Plot-1: (a) The message signal (use -axis limits ) (b) The frequency modulated signal using . Use the same axis limits as above. (c) The magnitude spectra of and [2] Plot-2: Repeat all parts of [1] from above using and explain the differences [3] Plot-3: For the frequency modulated signal using , plot (a) The FM derivative signal and the rectified FM derivative signal (b) The demodulated signal and the magnitude spectrum of [4] Plot-4: Repeat part [3] above using and explain the differences.