Home /
Expert Answers /
Statistics and Probability /
please-answer-part-iv-and-v-iv-the-scatterplot-below-shows-simulated-data-scatter-the-true-rela-pa380
(Solved): Please answer part iv. and v. iv. The scatterplot below shows simulated data scatter. The true rela ...
Please answer part iv. and v.
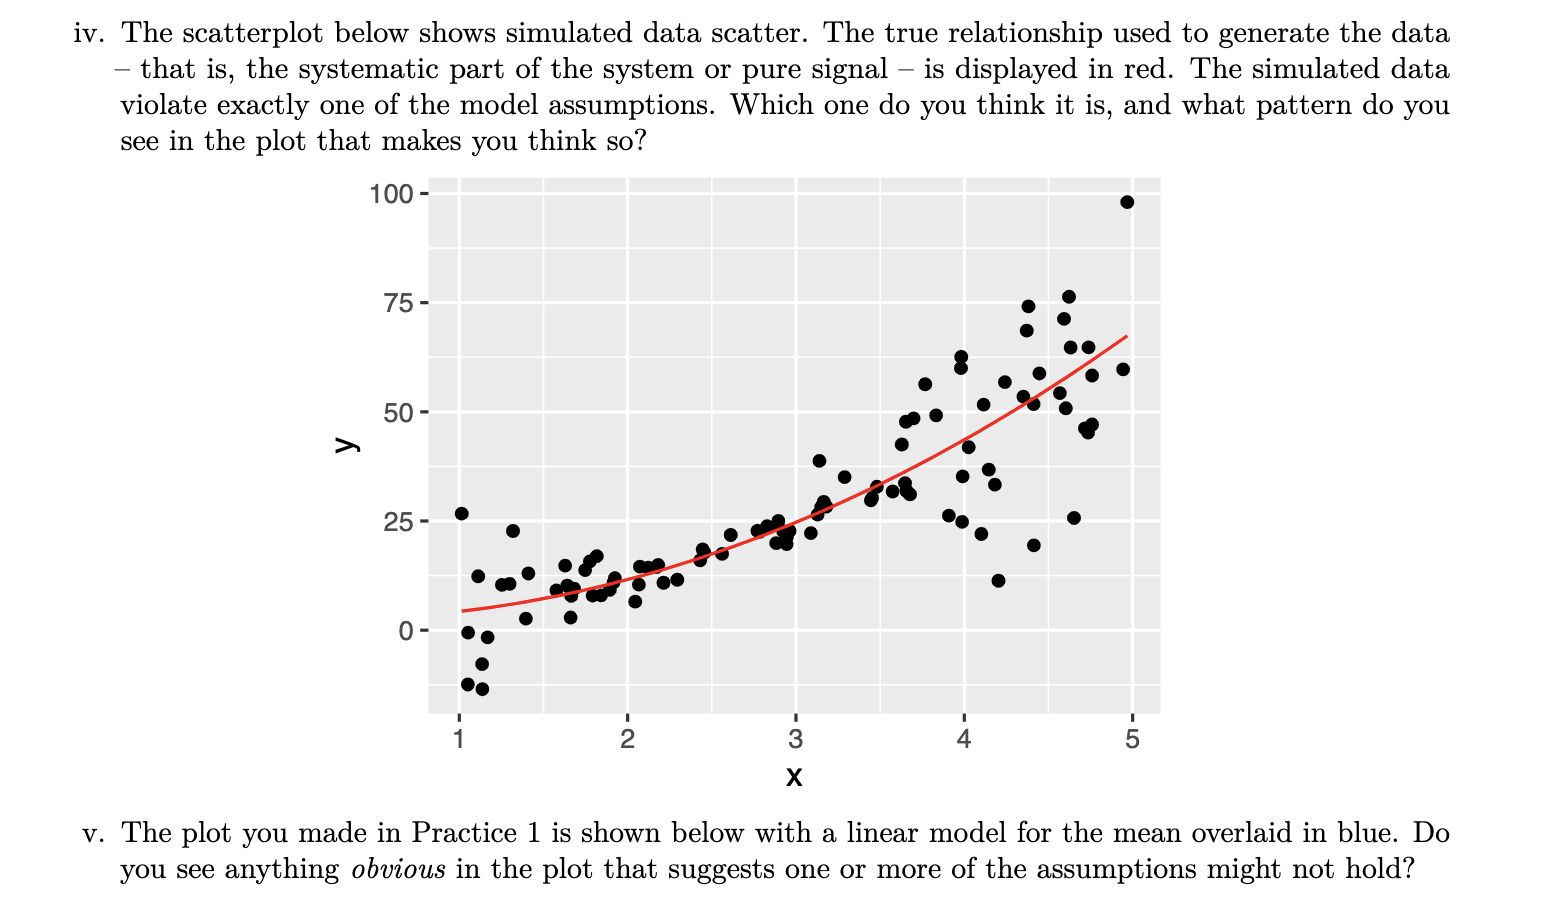
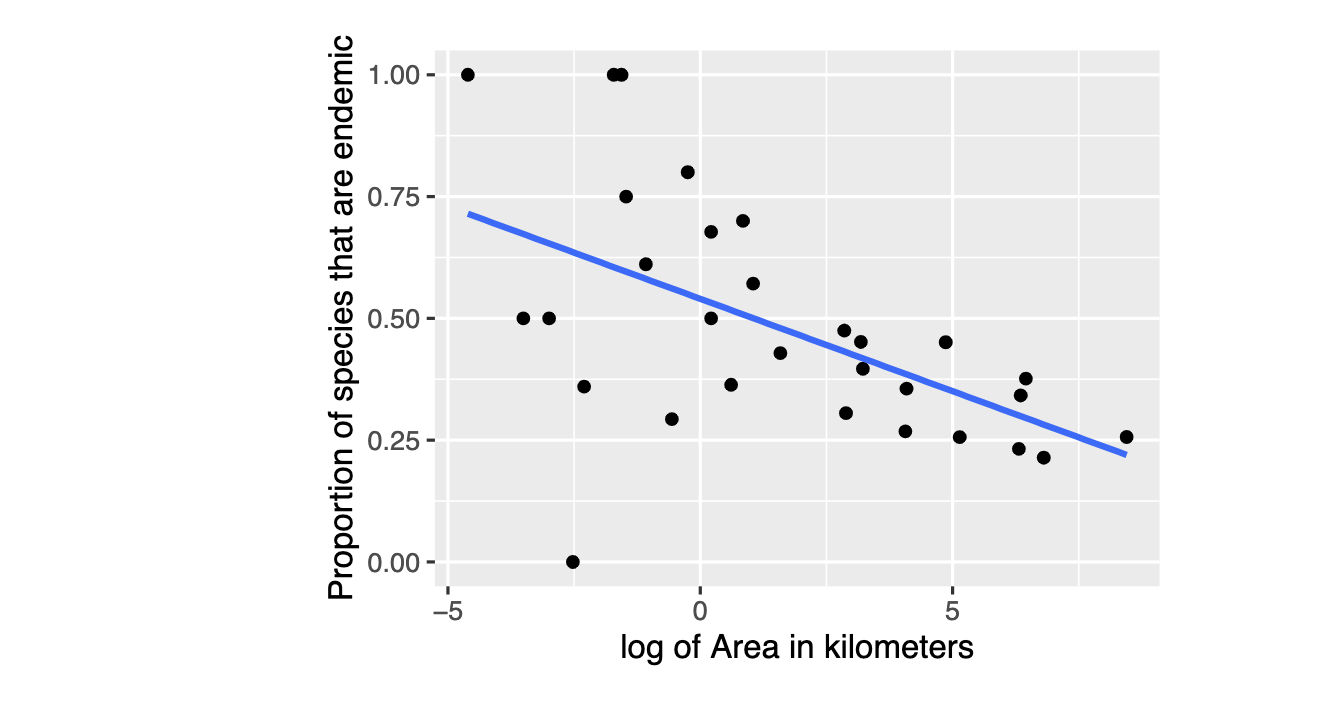
iv. The scatterplot below shows simulated data scatter. The true relationship used to generate the data - that is, the systematic part of the system or pure signal - is displayed in red. The simulated data violate exactly one of the model assumptions. Which one do you think it is, and what pattern do you see in the plot that makes you think so? v. The plot you made in Practice 1 is shown below with a linear model for the mean overlaid in blue. Do you see anything obvious in the plot that suggests one or more of the assumptions might not hold?
log of Area in kilometers