Home /
Expert Answers /
Electrical Engineering /
p-2-2-figure-p-2-2-is-a-plot-of-a-sinusoidal-wave-from-the-plot-determine-values-for-the-amplitud-pa503
(Solved): P-2.2 Figure P-2.2 is a plot of a sinusoidal wave. From the plot, determine values for the amplitud ...
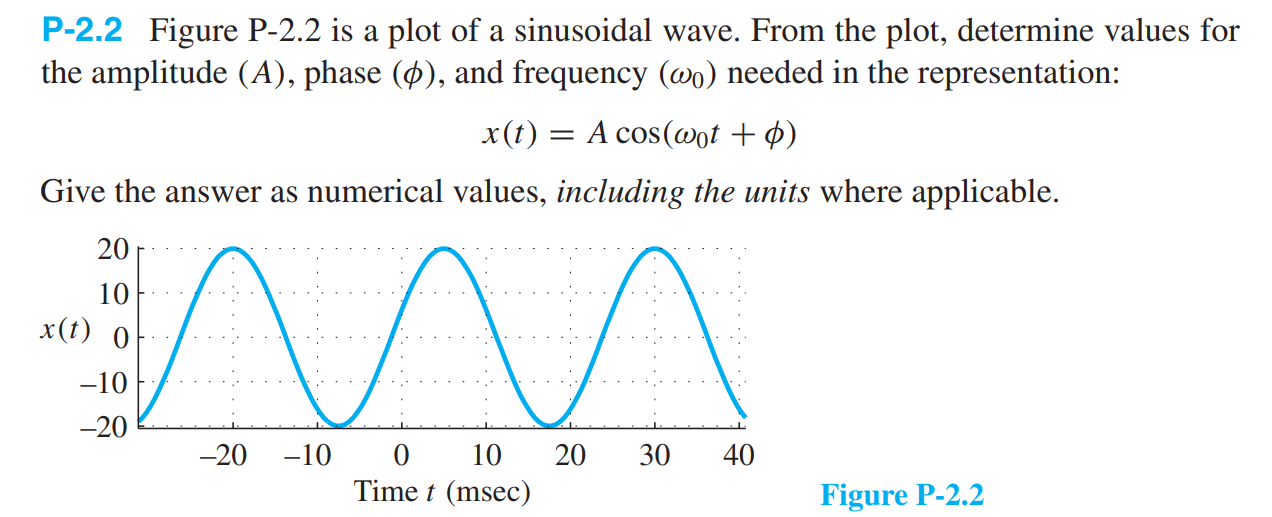
P-2.2 Figure P-2.2 is a plot of a sinusoidal wave. From the plot, determine values for the amplitude , phase , and frequency needed in the representation: Give the answer as numerical values, including the units where applicable. Figure P-2.2