Home /
Expert Answers /
Economics /
ols-of-6-working-with-numbers-and-graphs-q6-adjust-the-following-graph-to-show-how-fiscal-policy-wo-pa890
(Solved): ols of 6. Working with Numbers and Graphs Q6 Adjust the following graph to show how fiscal policy wo ...
ols of 6. Working with Numbers and Graphs Q6 Adjust the following graph to show how fiscal policy works in the ideal case
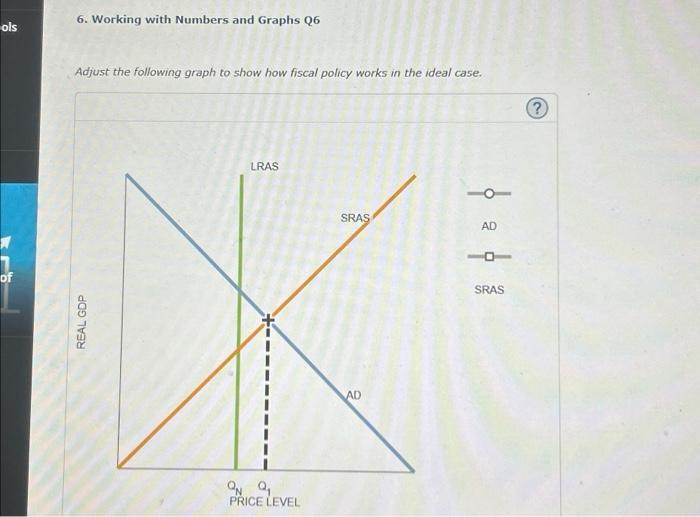
6. Working with Numbers and Graphs Q6 Adjust the following graph to show how fiscal policy works in the ideal case.