Home /
Expert Answers /
Advanced Physics /
need-asap-please-i-beg-you-thank-you-in-advance-nbsp-figure-1-shows-a-graph-of-log-t-v-pa493
(Solved): Need ASAP Please I beg you. Thank you in advance (Figure 1) shows a graph of \( \log T \) v ...
Need ASAP Please I beg you. Thank you in advance
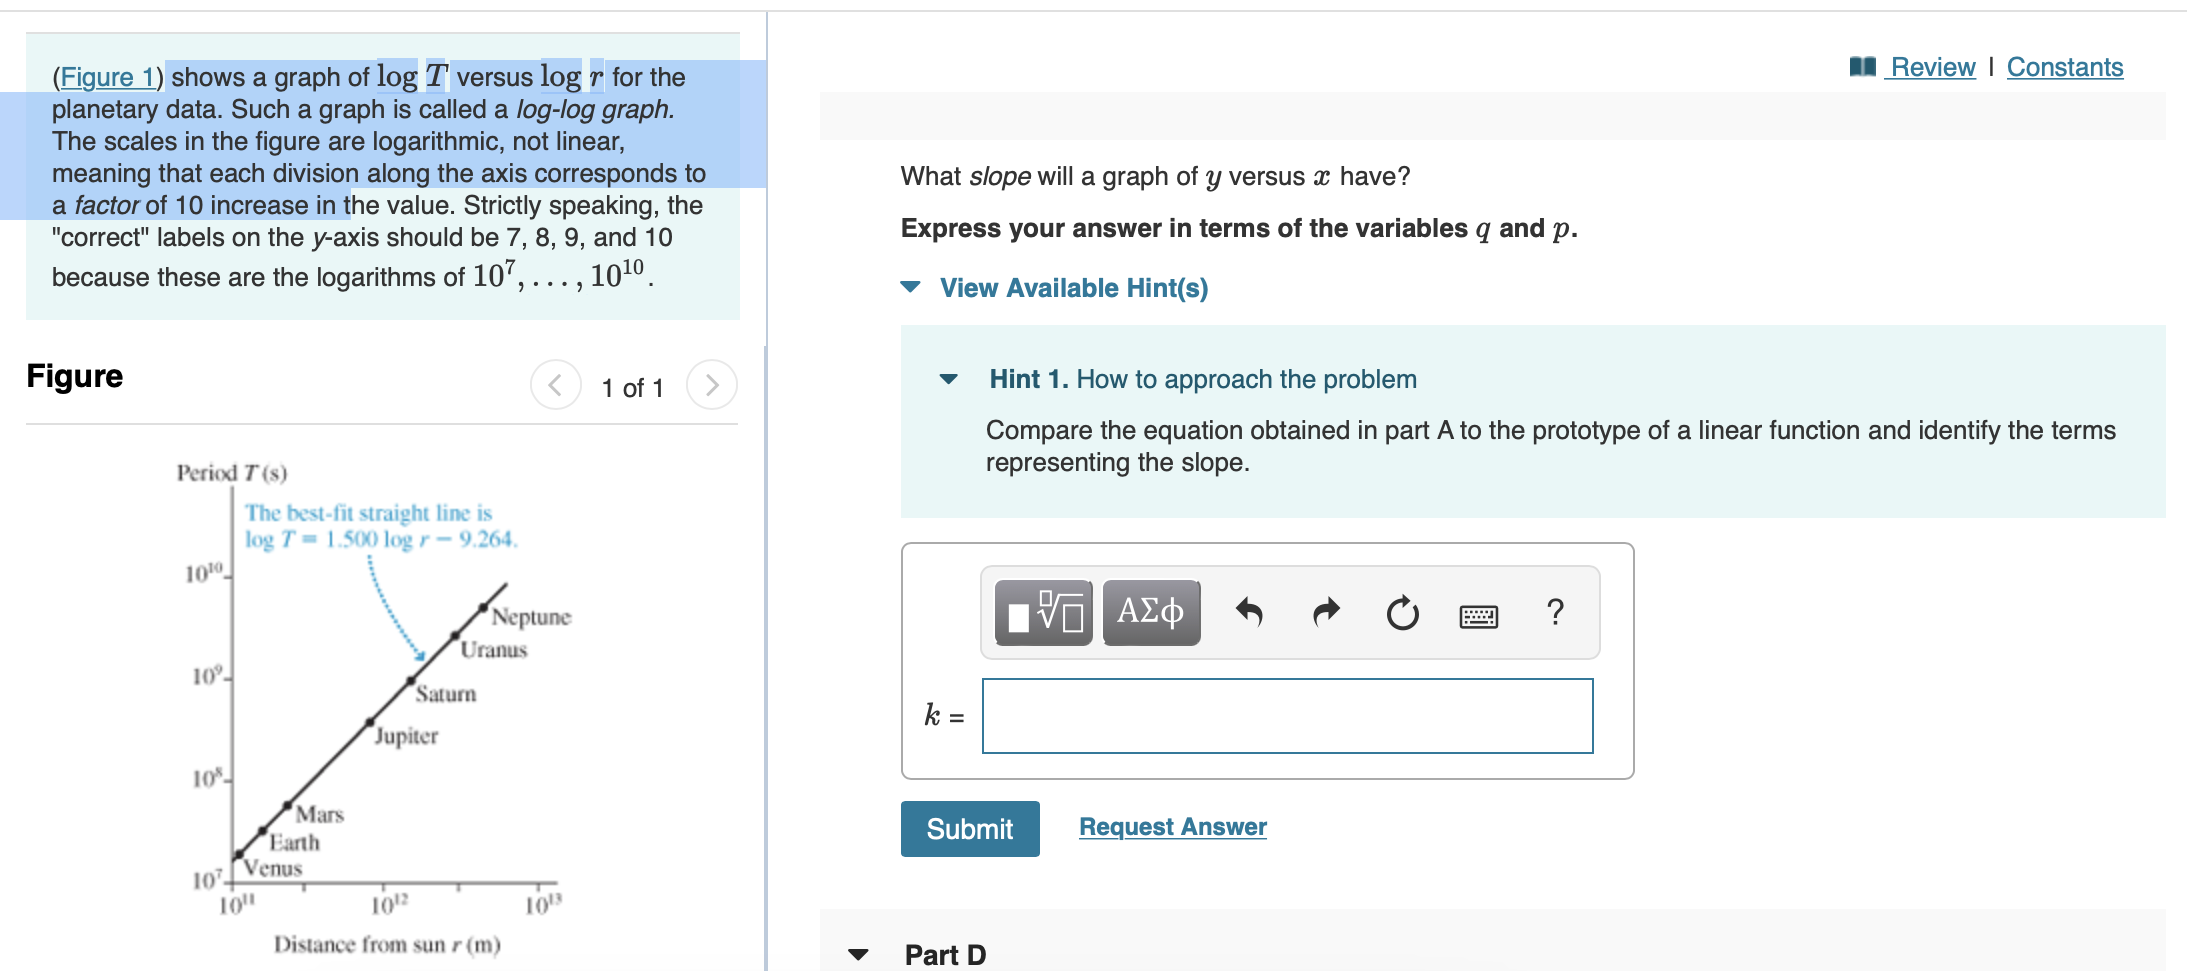
(Figure 1) shows a graph of \( \log T \) versus \( \log r \) for the planetary data. Such a graph is called a \( \log -\log \) graph. The scales in the figure are logarithmic, not linear, meaning that each division along the axis corresponds to What slope will a graph of \( y \) versus \( x \) have? a factor of 10 increase in the value. Strictly speaking, the "correct" labels on the \( y \)-axis should be \( 7,8,9 \), and 10 Express your answer in terms of the variables \( q \) and \( p \). because these are the logarithms of \( 10^{7}, \ldots, 10^{10} \). Figure 1 of 1 Hint 1. How to approach the problem Compare the equation obtained in part A to the prototype of a linear function and identify the terms representing the slope.
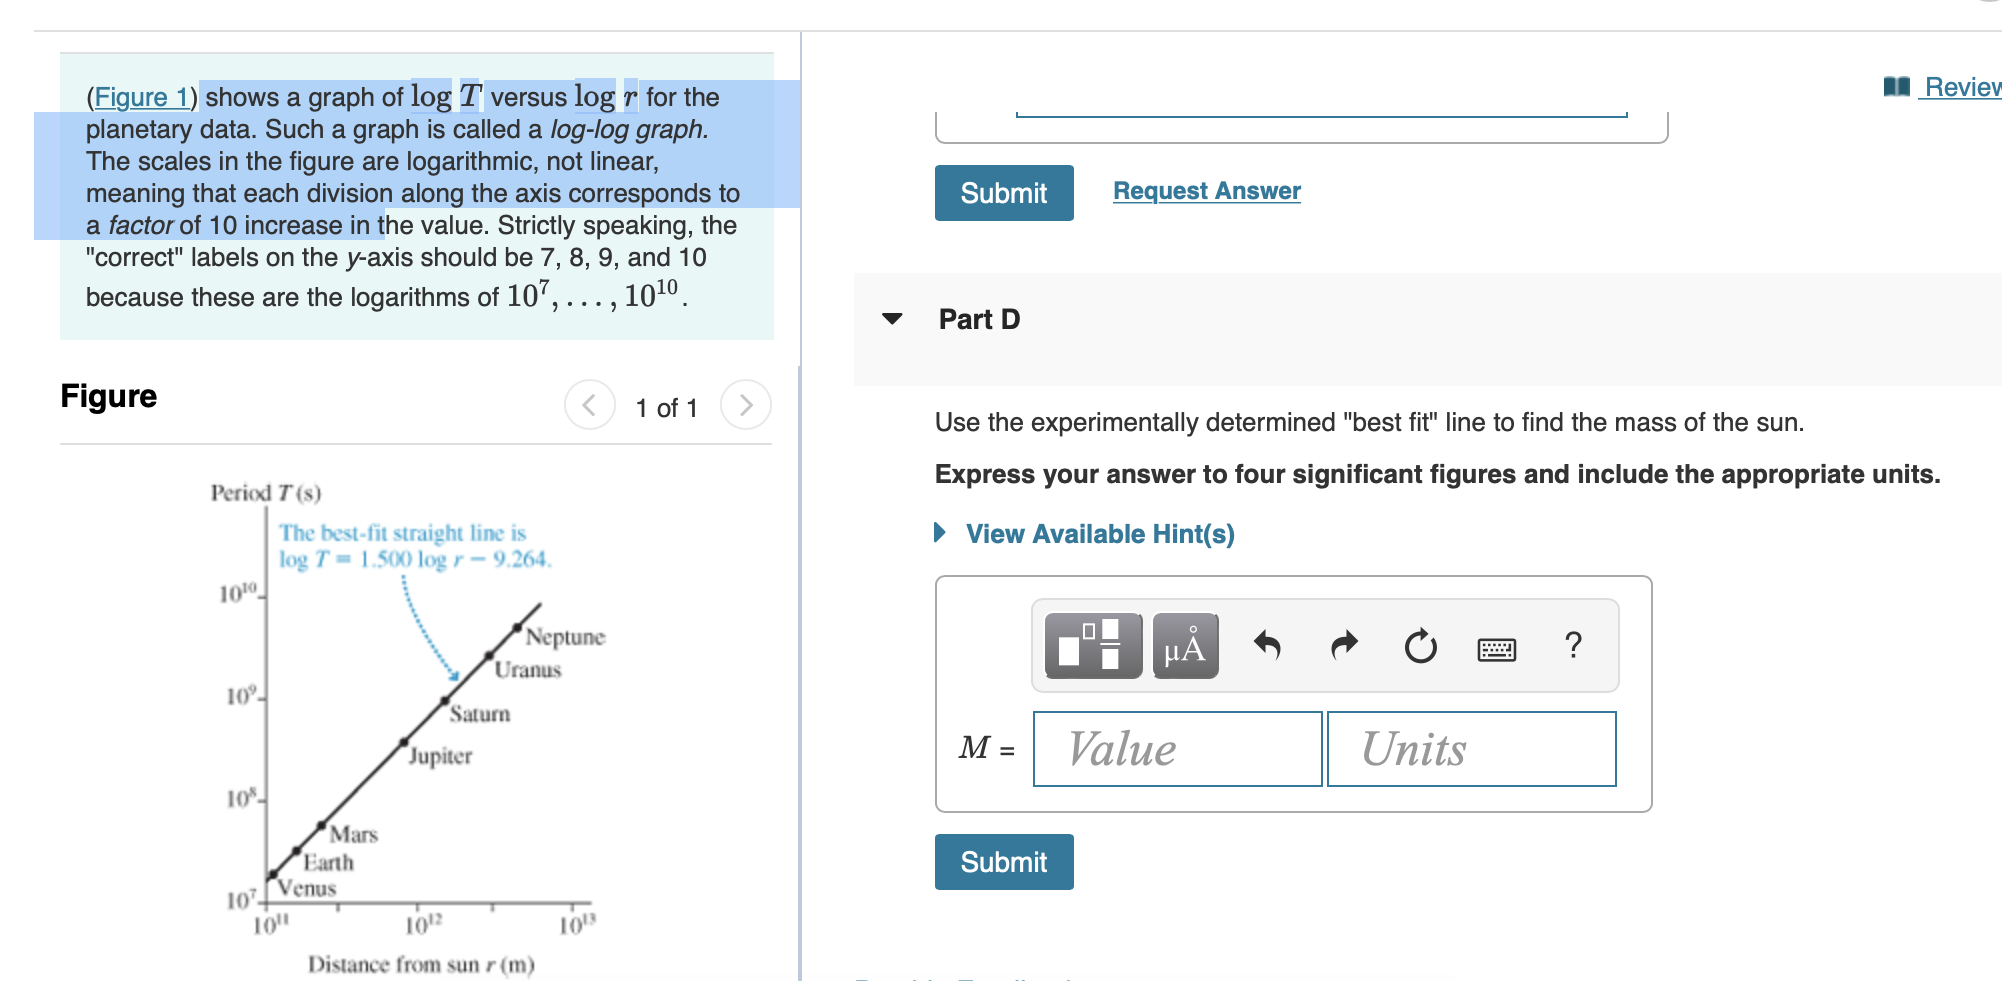
(Figure 1) shows a graph of \( \log T \) versus \( \log r \) for the planetary data. Such a graph is called a log-log graph. The scales in the figure are logarithmic, not linear, meaning that each division along the axis corresponds to a factor of 10 increase in the value. Strictly speaking, the "correct" labels on the \( y \)-axis should be \( 7,8,9 \), and 10 because these are the logarithms of \( 10^{7}, \ldots, 10^{10} \). Part D Figure 1 of 1 Use the experimentally determined "best fit" line to find the mass of the sun. Express your answer to four significant figures and include the appropriate units.
Expert Answer
1 . From part A we can see that, vp=Cuq Where, p and q are some constant

