Home /
Expert Answers /
Economics /
nbsp-the-graph-to-the-right-depicts-the-market-for-unskilled-labor-assuming-all-workers-are-id-pa353
(Solved): The graph to the right depicts the market for unskilled labor. Assuming all workers are id ...
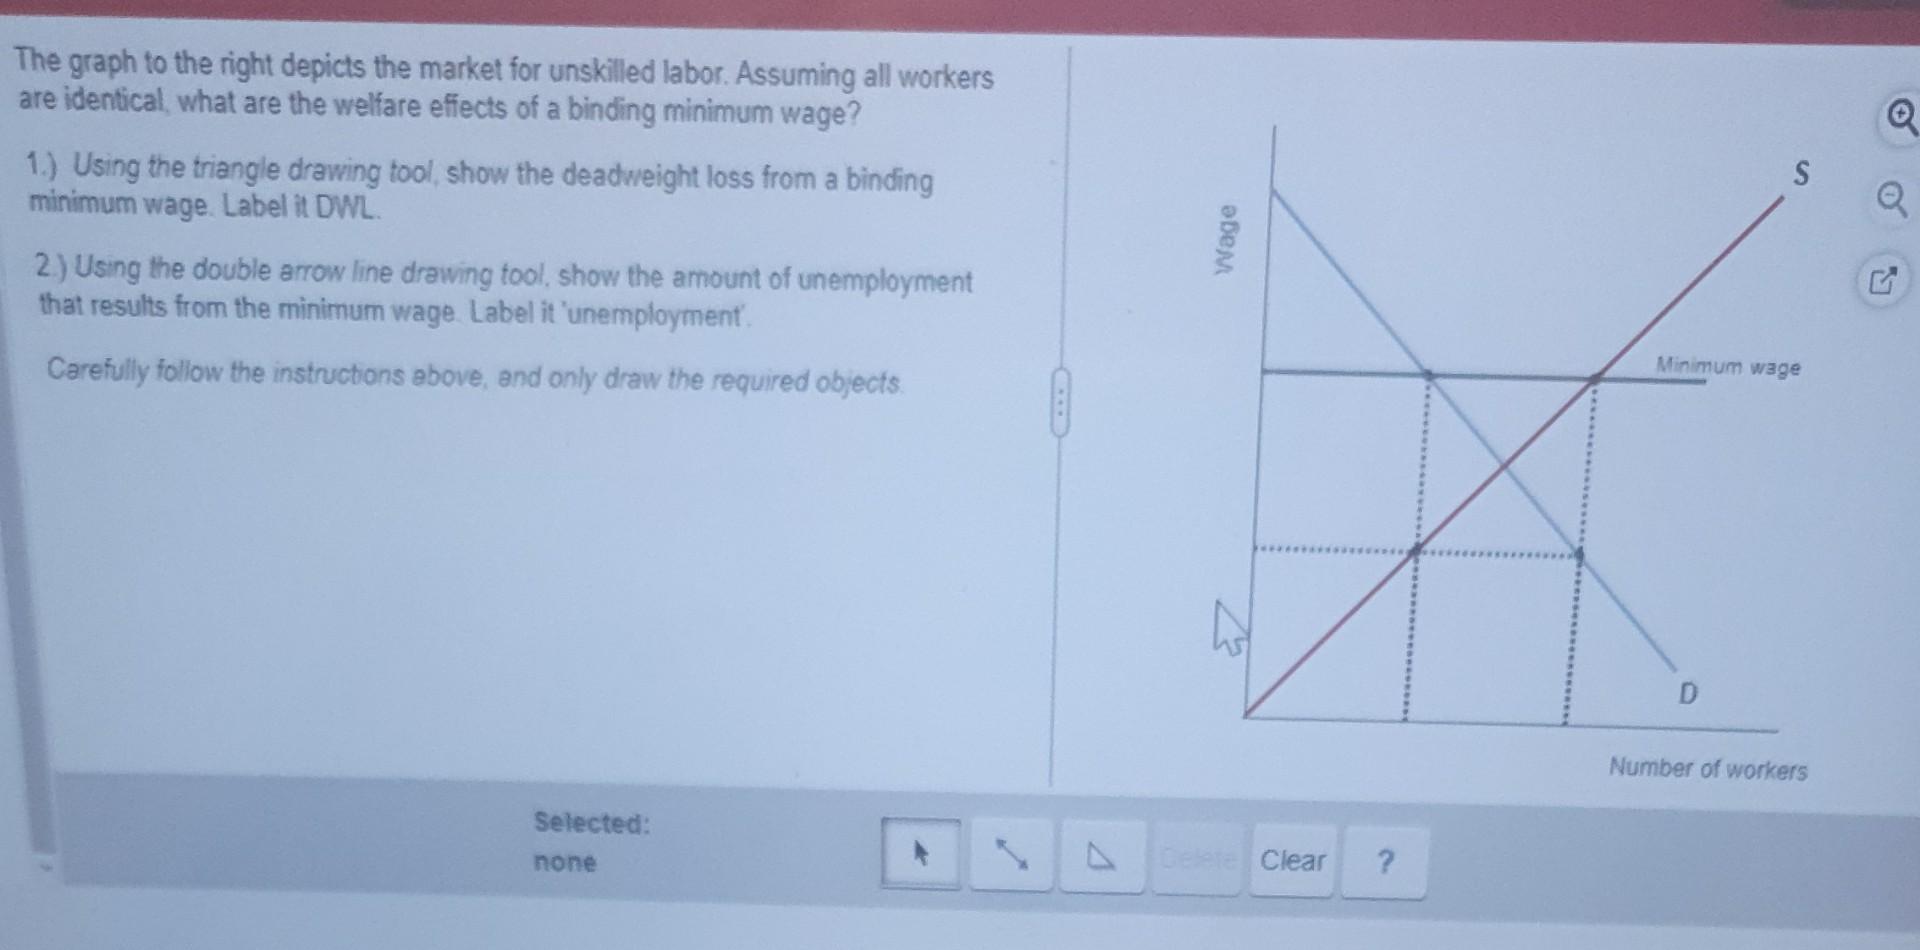
The graph to the right depicts the market for unskilled labor. Assuming all workers are identical, what are the welfare effects of a binding minimum wage? 1.) Using the triangle drawing tool, show the deadweight loss from a binding minimum wage. Label it DWL. 2.) Using the double arrow line drawing tool, show the amount of unemployment that results from the minimum wage. Label it 'unemployment'. Carefully follow the instructions above, and only draw the required objects.