Home /
Expert Answers /
Economics /
nbsp-on-the-graph-draw-a-demand-for-labor-curve-and-a-supply-of-labor-curve-label-the-curves-pa797
(Solved): On the graph, draw a demand for labor curve and a supply of labor curve. Label the curves. ...
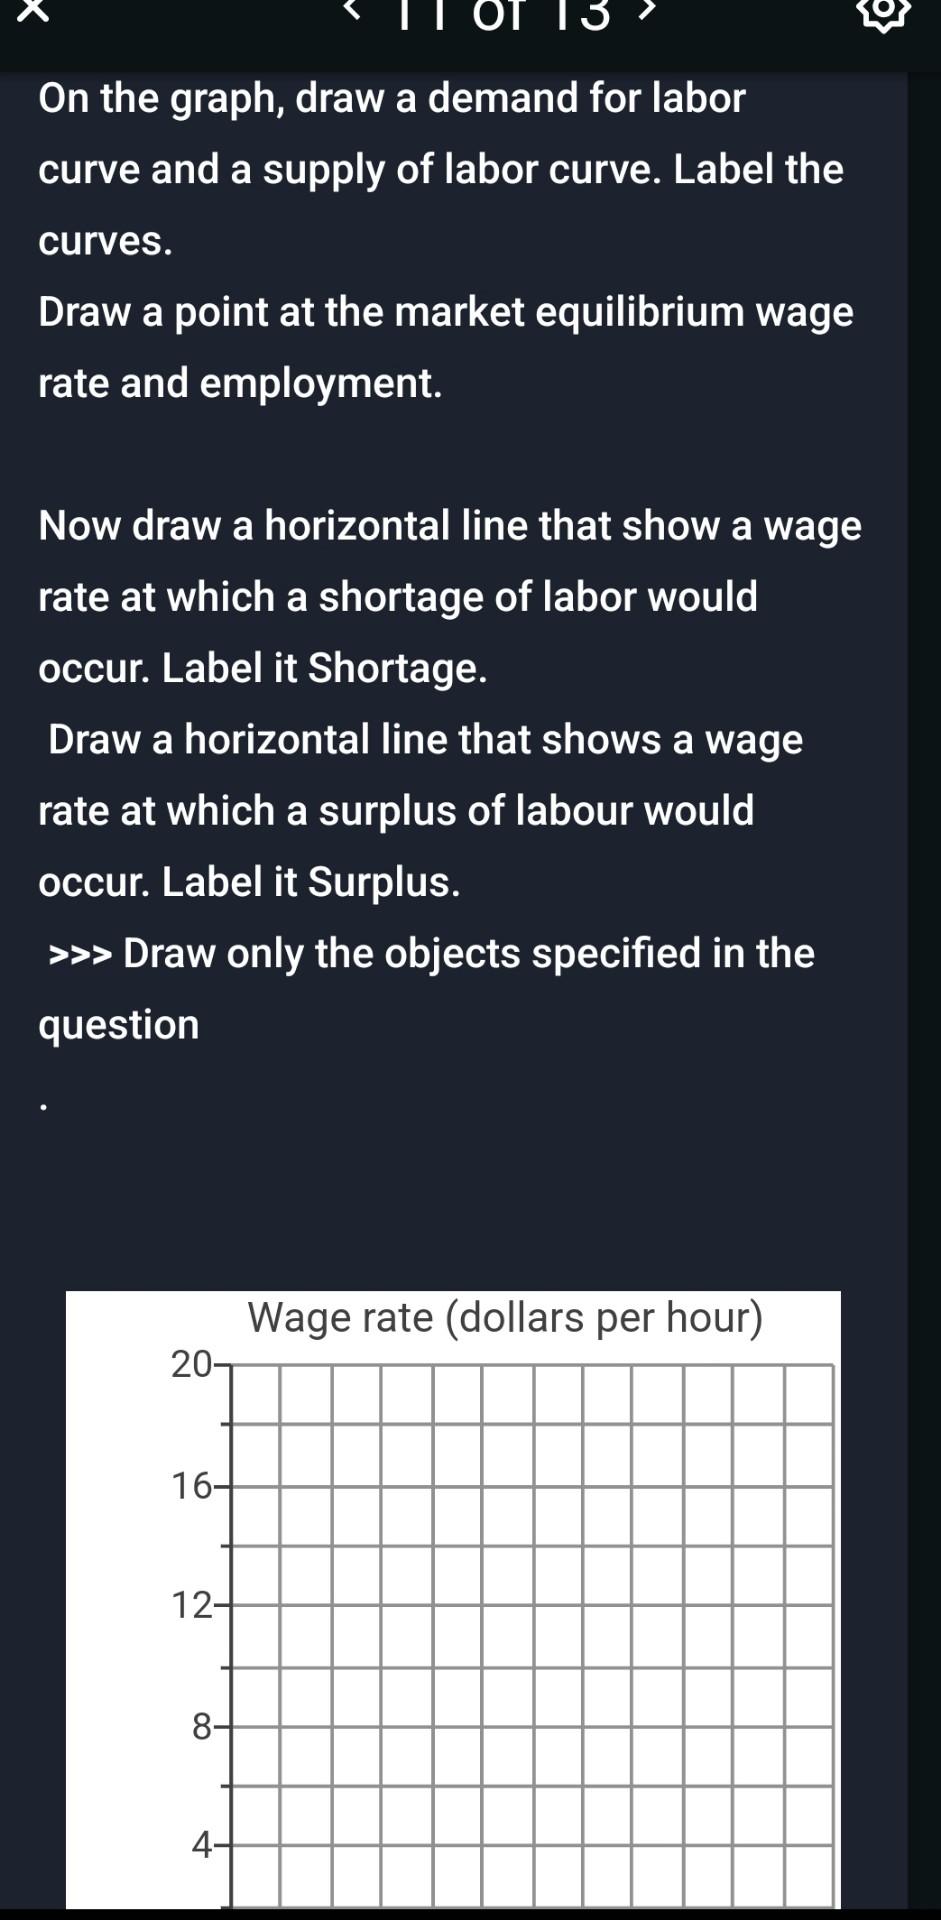
On the graph, draw a demand for labor curve and a supply of labor curve. Label the curves. Draw a point at the market equilibrium wage rate and employment. Now draw a horizontal line that show a wage rate at which a shortage of labor would occur. Label it Shortage. Draw a horizontal line that shows a wage rate at which a surplus of labour would occur. Label it Surplus. \( \gg \) Draw only the objects specified in the question
Expert Answer
Ans: Explanation: In the above figure , Demand curve for labor slopes down ward and supply curve for labor slopes upwar