Home /
Expert Answers /
Chemical Engineering /
nbsp-nbsp-the-diagram-below-shows-pv-changes-during-the-isothermal-expansion-and-contraction-p-pa620
(Solved): The diagram below shows PV changes during the isothermal expansion and contraction p ...
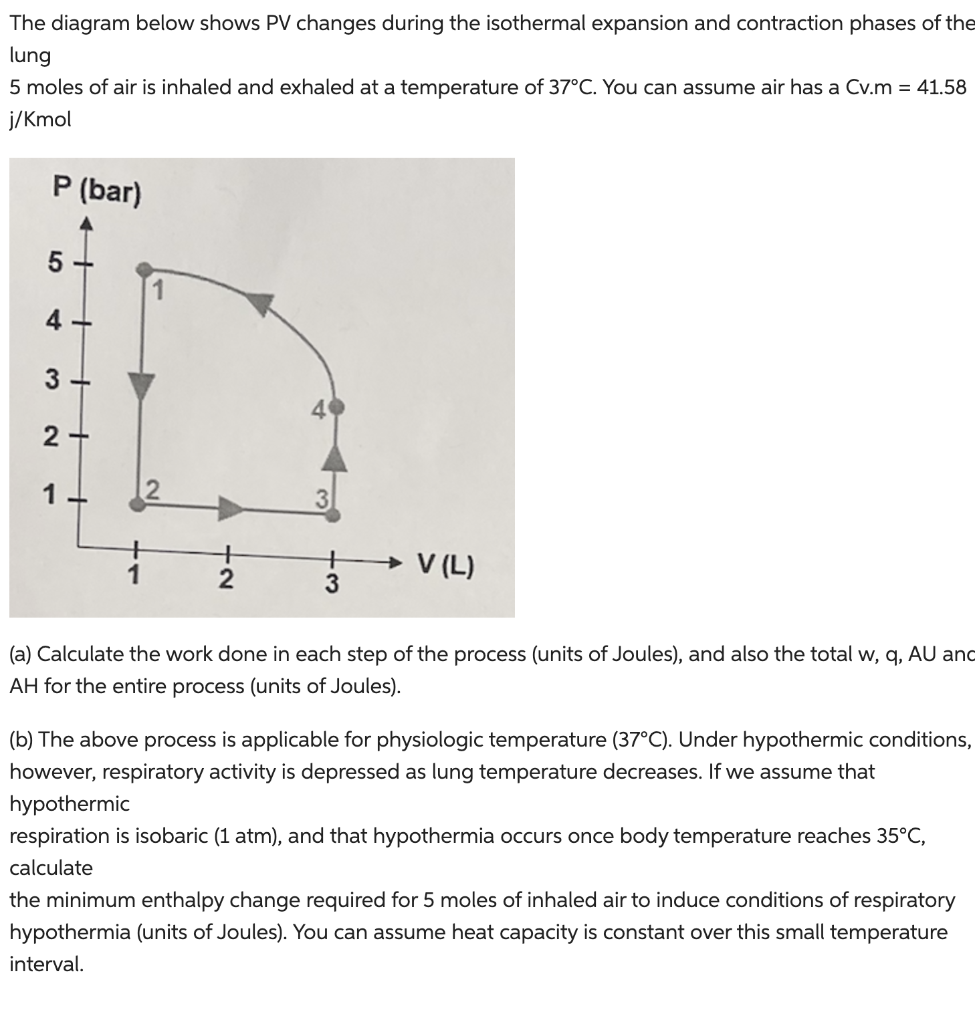
The diagram below shows PV changes during the isothermal expansion and contraction phases of the lung 5 moles of air is inhaled and exhaled at a temperature of \( 37^{\circ} \mathrm{C} \). You can assume air has a Cv.m \( =41.58 \) \( \mathrm{j} / \mathrm{Kmol} \) (a) Calculate the work done in each step of the process (units of Joules), and also the total w, q, AU and AH for the entire process (units of Joules). (b) The above process is applicable for physiologic temperature \( \left(37^{\circ} \mathrm{C}\right) \). Under hypothermic conditions, however, respiratory activity is depressed as lung temperature decreases. If we assume that hypothermic respiration is isobaric (1 atm), and that hypothermia occurs once body temperature reaches \( 35^{\circ} \mathrm{C} \), calculate the minimum enthalpy change required for 5 moles of inhaled air to induce conditions of respiratory hypothermia (units of Joules). You can assume heat capacity is constant over this small temperature interval.