Home /
Expert Answers /
Chemistry /
nbsp-answer-for-d-please-the-following-figure-depicts-the-oxygen-binding-curve-for-hemoglobin-so-pa876
(Solved): Answer for D please The following figure depicts the oxygen binding curve for hemoglobin. So ...

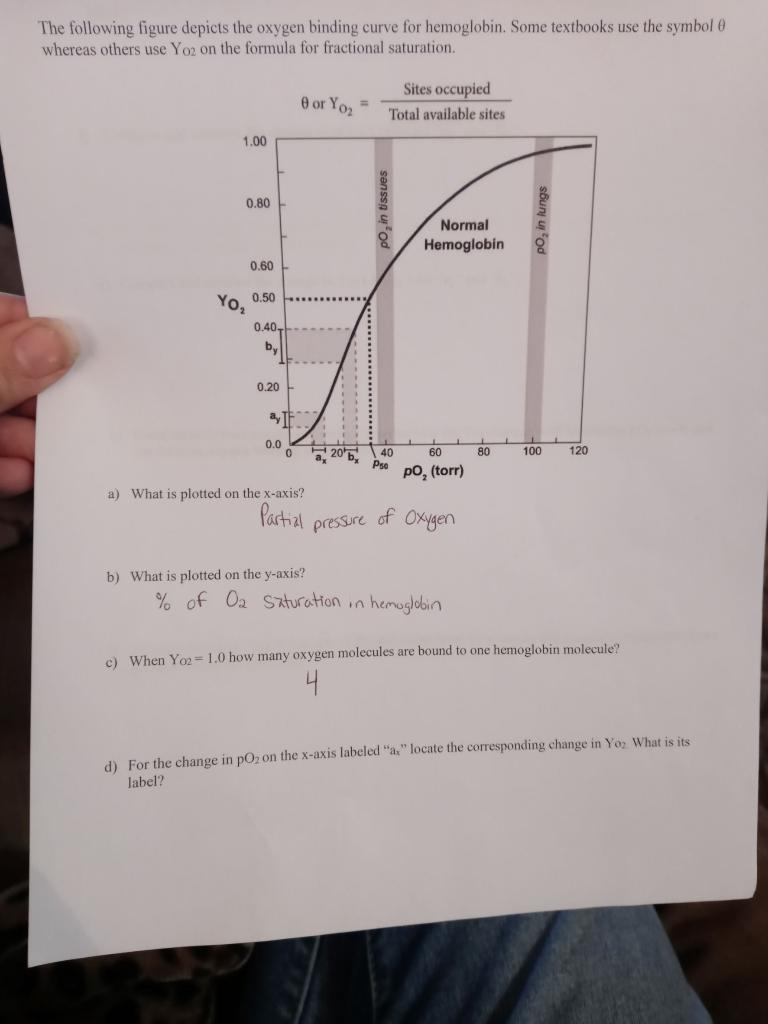
The following figure depicts the oxygen binding curve for hemoglobin. Some textbooks use the symbol \( \theta \) whereas others use \( \mathrm{Y}_{02} \) on the formula for fractional saturation. \[ \theta \text { or } \mathrm{Y}_{\mathrm{O}_{2}}=\frac{\text { Sites occupied }}{\text { Total available sites }} \] a) What is plotted on the \( x \)-axis? Partial pressure of Oxygen b) What is plotted on the \( y \)-axis? \( \% \) of \( \mathrm{O}_{2} \) Sxturation in hemoglobin c) When \( \mathrm{Y}_{02}=1.0 \) how many oxygen molecules are bound to one hemoglobin molecule? 4 d) For the change in \( \mathrm{pO}_{2} \) on the \( \mathrm{x} \)-axis labeled "a" locate the corresponding change in \( \mathrm{Y}_{0} \). What is its label?
Expert Answer
As you asked for only part (D