Home /
Expert Answers /
Statistics and Probability /
national-college-health-assessment-survey-the-following-exercise-uses-data-on-college-students-col-pa854
(Solved): National College Health Assessment Survey The following exercise uses data on college students col ...
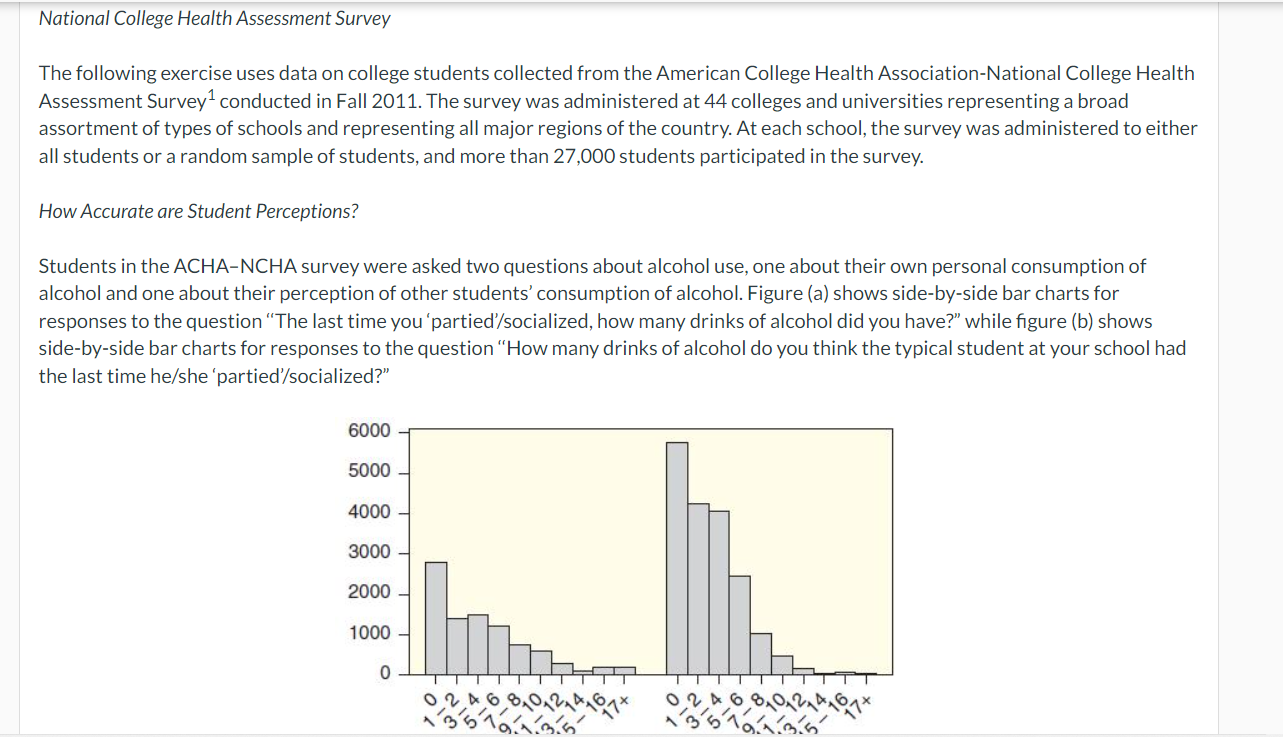
National College Health Assessment Survey The following exercise uses data on college students collected from the American College Health Association-National College Health Assessment Survey \( { }^{1} \) conducted in Fall 2011. The survey was administered at 44 colleges and universities representing a broad assortment of types of schools and representing all major regions of the country. At each school, the survey was administered to either all students or a random sample of students, and more than 27,000 students participated in the survey. How Accurate are Student Perceptions? Students in the ACHA-NCHA survey were asked two questions about alcohol use, one about their own personal consumption of alcohol and one about their perception of other students' consumption of alcohol. Figure (a) shows side-by-side bar charts for responses to the question "The last time you 'partied'/socialized, how many drinks of alcohol did you have?" while figure (b) shows side-by-side bar charts for responses to the question "How many drinks of alcohol do you think the typical student at your school had the last time he/she 'partied'/socialized?"
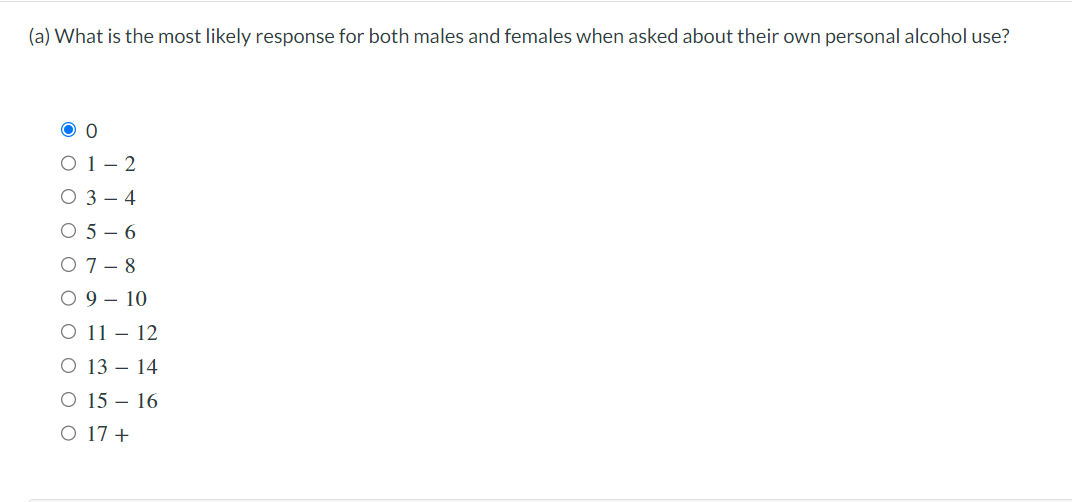
(a) What is the most likely response for both males and females when asked about their own personal alcohol use? \[ \begin{array}{l} 0 \\ 1-2 \\ 3-4 \\ 5-6 \\ 7-8 \\ 9-10 \\ 11-12 \\ 13-14 \\ 15-16 \\ 17+ \end{array} \]
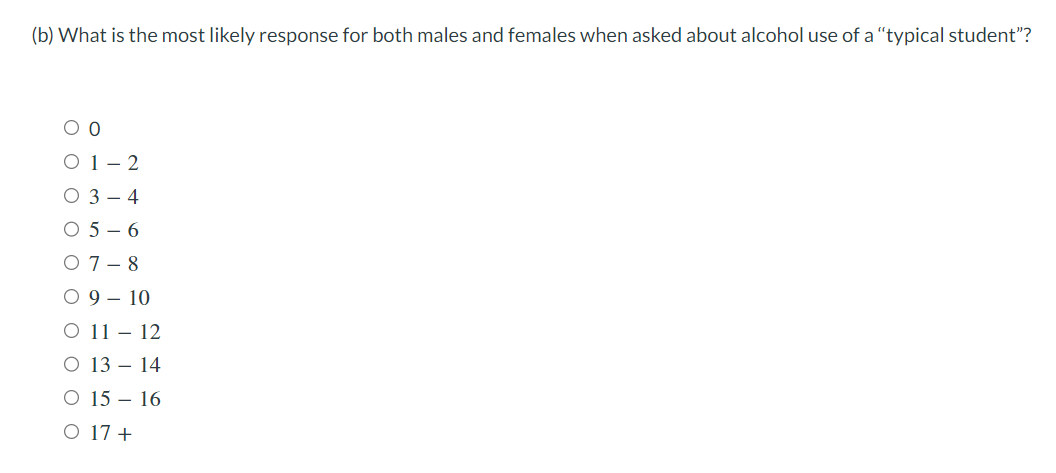
(b) What is the most likely response for both males and females when asked about alcohol use of a "typical student"? \[ \begin{array}{l} 0 \\ 1-2 \\ 3-4 \\ 5-6 \\ 7-8 \\ 9-10 \\ 11-12 \\ 13-14 \\ 15-16 \\ 17+ \end{array} \]
Expert Answer
(a) The first graph shows the responses about personal alcohol use. The highest bar


