Home /
Expert Answers /
Computer Science /
matlab-when-you-run-the-program-you-should-see-the-following-graph-exercise-2-create-a-pie-chart-pa708
(Solved): Matlab When you run the program, you should see the following graph. Exercise 2: Create a pie chart ...
Matlab
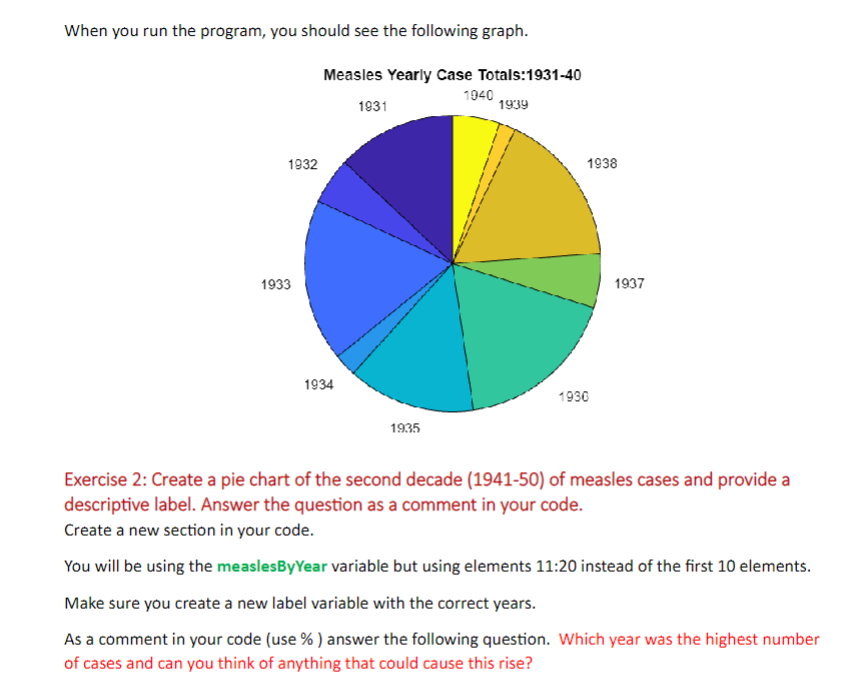
When you run the program, you should see the following graph. Exercise 2: Create a pie chart of the second decade (1941-50) of measles cases and provide a descriptive label. Answer the question as a comment in your code. Create a new section in your code. You will be using the measlesByYear variable but using elements 11:20 instead of the first 10 elements. Make sure you create a new label variable with the correct years. As a comment in your code (use \%) answer the following question. Which year was the highest number of cases and can you think of anything that could cause this rise?