Home /
Expert Answers /
Chemistry /
matlab-code-please-1-create-two-plots-as-in-figure-1a-and-figure-1b-showing-the-effect-on-sa-pa242
(Solved): Matlab code please 1) Create two plots as in Figure 1a and Figure 1b, showing the effect on sa ...
Matlab code please
1) Create two plots as in Figure and Figure , showing the effect on sample size on the confidence intervals. - Use the following parameters: - Total number of bearings: - Population mean: 100 grams - Population standard deviation: 12 grams - Sample sizes:
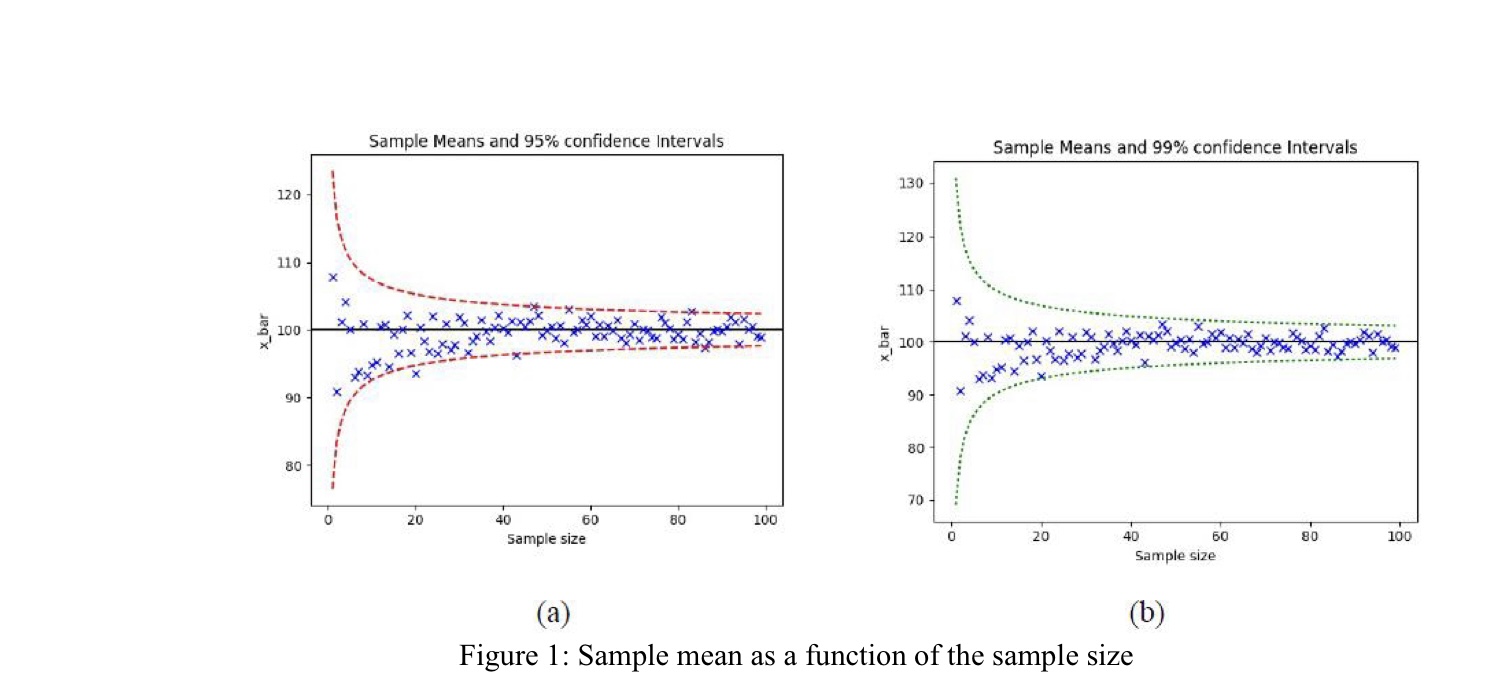
(a) (b) Figure 1: Sample mean as a function of the sample size
Expert Answer
As you have asked for the matlab code I am providing it.