Home /
Expert Answers /
Economics /
llowing-graph-plots-a-supply-curve-for-some-hypothetical-good-for-each-of-the-regions-use-the-m-pa222
(Solved): llowing graph plots a supply curve for some hypothetical good. For each of the regions, use the m ...
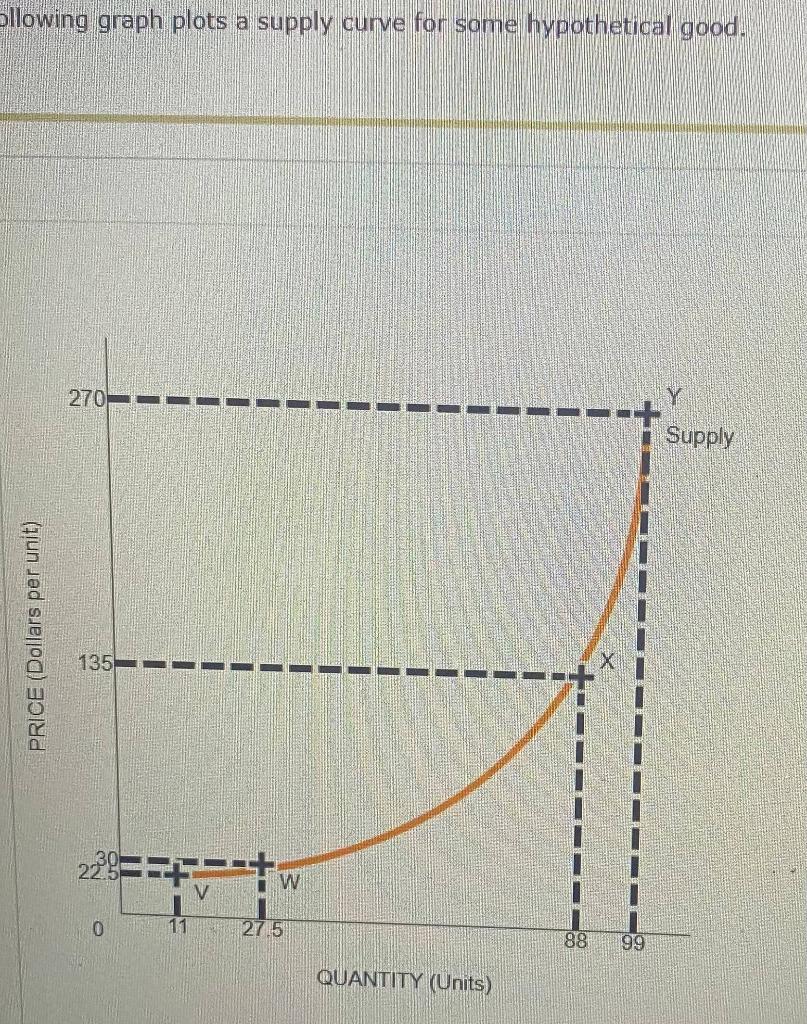
llowing graph plots a supply curve for some hypothetical good.
For each of the regions, use the midpoint method to identify whether the supply of this good is elastic or inelastic. True or False: As firms reach near maximum capacity at high levels of quantity supplied, supply becomes less elastic because firms may need to inve nadditional capital in order to further increase production. True False
Expert Answer
Es=P1+P2Q1+Q2xQ2?Q1P2?P1Between W

