Home /
Expert Answers /
Calculus /
k-the-figure-to-the-right-shows-four-regions-bounded-by-the-graph-of-y-xsin-x-r-r-r3-and-r-pa334
(Solved): K The figure to the right shows four regions bounded by the graph of y=xsin x: R, R, R3, and R ...
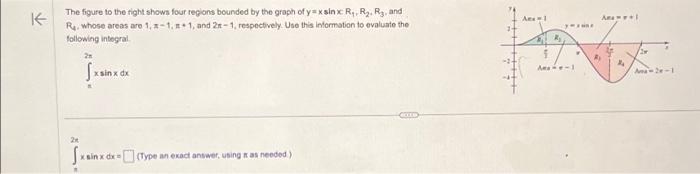
K The figure to the right shows four regions bounded by the graph of y=xsin x: R?, R?, R3, and R4, whose areas are 1, x-1, +1, and 2-1, respectively. Use this information to evaluate the following integral. 2 T 2 [xs ? x sin x dx x sin x dx = (Type an exact answer, using as needed.) **** Area = 1 y=x sinx R? R? ? Area = -1 T Ry Area = = +1 R? 2 Area = 2m-1
The figure to the tight shows four regions bounded by the groph of , and , whose areas are , and , respectively. Use this information to evaluate the following integral. (Type an exadt answer, using an as needed)