Home /
Expert Answers /
Chemistry /
introduction-a-maxwell-boltzmann-curve-shows-the-distribution-of-energy-for-the-molecules-in-a-sai-pa795
(Solved): INTRODUCTION A Maxwell-Boltzmann curve shows the distribution of energy for the molecules in a sai ...
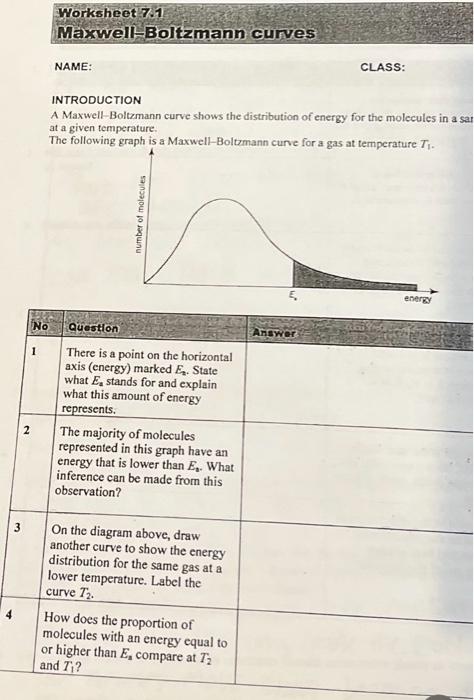
INTRODUCTION A Maxwell-Boltzmann curve shows the distribution of energy for the molecules in a sai at a given temperature. The following graph is a Maxwell-Boltamann curve for a gas at temperature \( T_{1} \).