Home /
Expert Answers /
Statistics and Probability /
in-the-table-below-are-selected-values-for-the-oc-curve-for-the-acceptance-sampling-plan-n-2-pa404
(Solved): In the table below are selected values for the OC curve for the acceptance sampling plan n = 2 ...
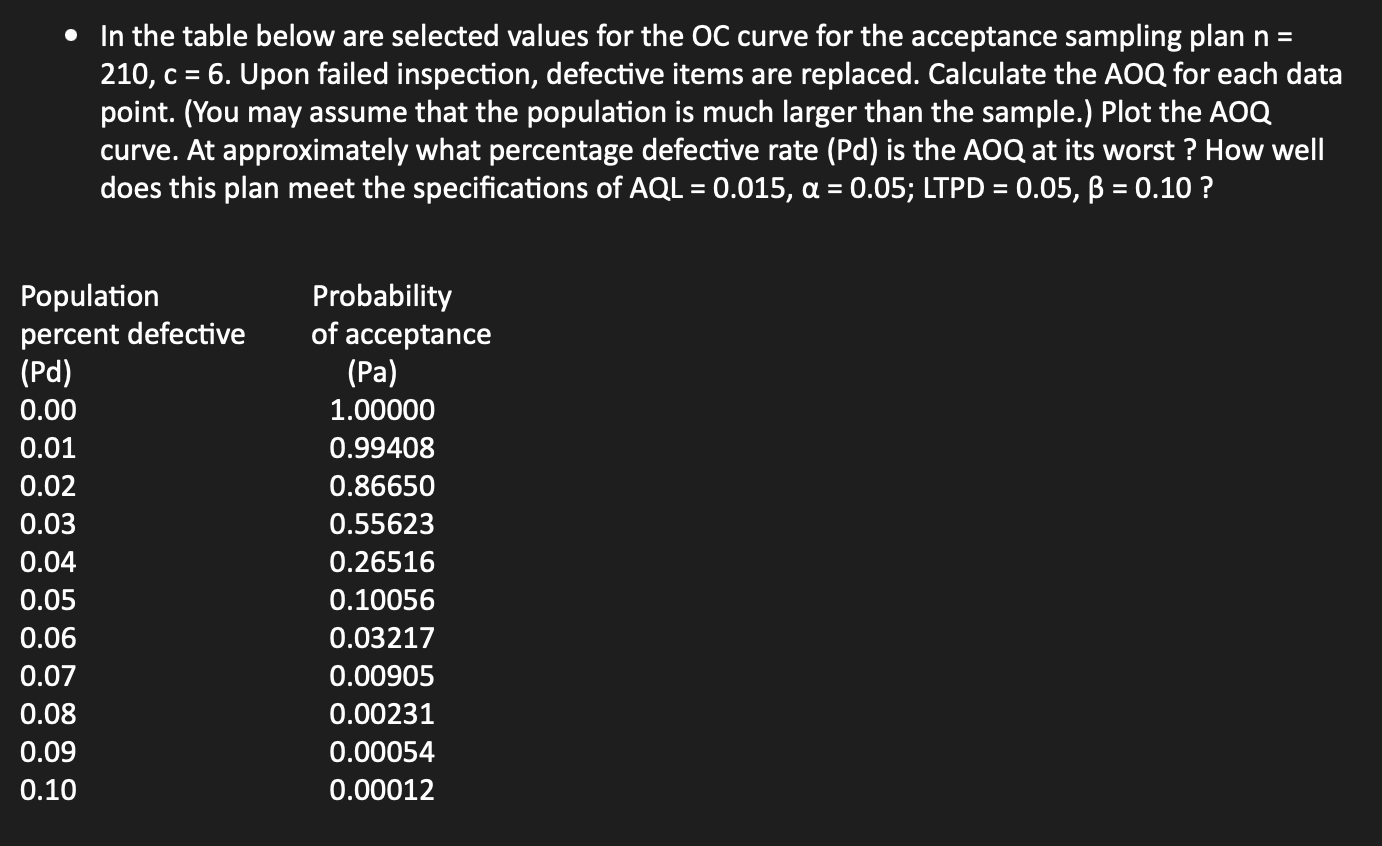
• In the table below are selected values for the OC curve for the acceptance sampling plan n = 210, c = 6. Upon failed inspection, defective items are replaced. Calculate the AOQ for each data point. (You may assume that the population is much larger than the sample.) Plot the AOQ curve. At approximately what percentage defective rate (Pd) is the AOQ at its worst? How well does this plan meet the specifications of AQL = 0.015, ? = 0.05; LTPD = 0.05, B = 0.10? Population percent defective (Pd) 0.00 0.01 0.02 0.03 0.04 0.05 0.06 0.07 0.08 0.09 0.10 Probability of acceptance (Pa) 1.00000 0.99408 0.86650 0.55623 0.26516 0.10056 0.03217 0.00905 0.00231 0.00054 0.00012
Expert Answer
(1)ANSWER::- AS FOR GIVEN DATA.... In the table below are selected values for the OC curve for the acceptance sampling plan n = 210, c = 6. Upon failed inspection, defective items are replaced. Calculate the AOQ for each data point. (You may assume t