Home /
Expert Answers /
Biology /
in-the-figure-above-which-of-the-lines-represents-exponential-growth-line-a-line-b-line-c-pa515
(Solved): In the figure above, which of the lines represents exponential growth? line \( A \) line B line C ...
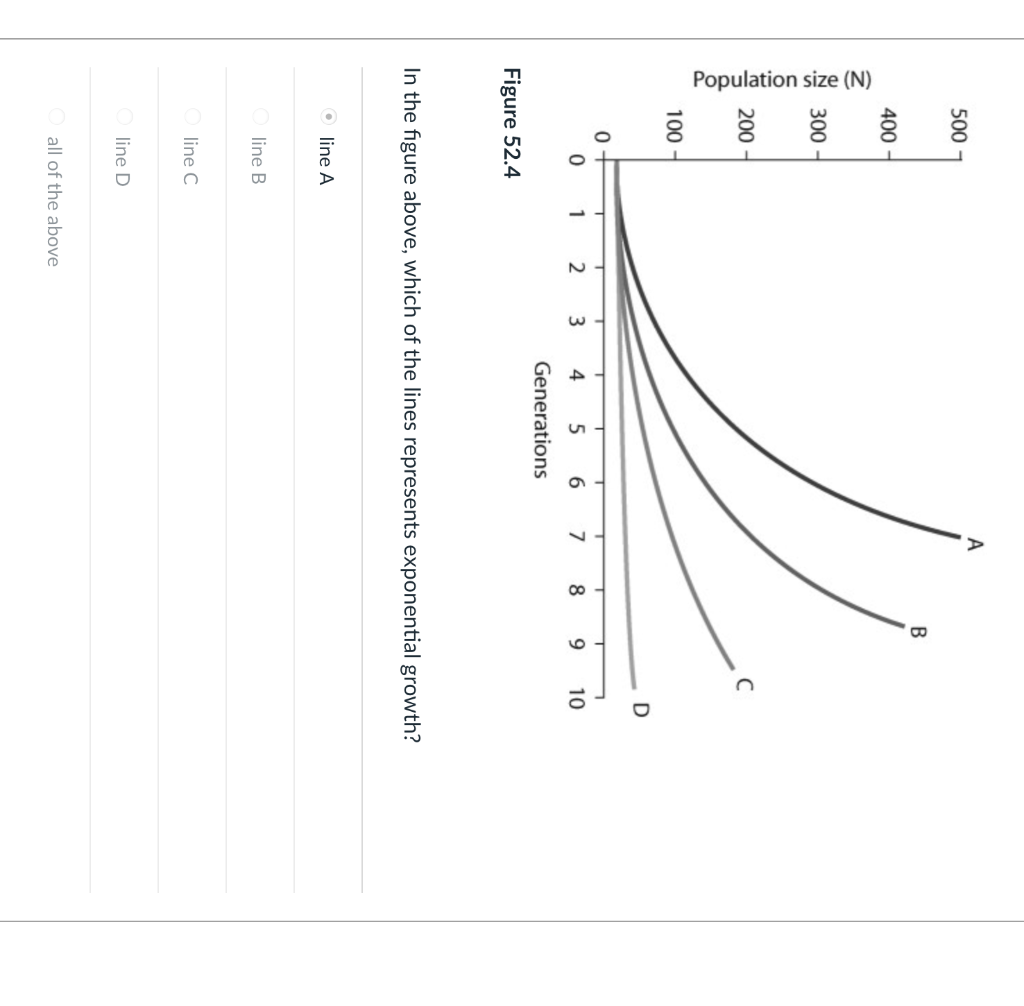
In the figure above, which of the lines represents exponential growth? line \( A \) line B line C line D all of the above
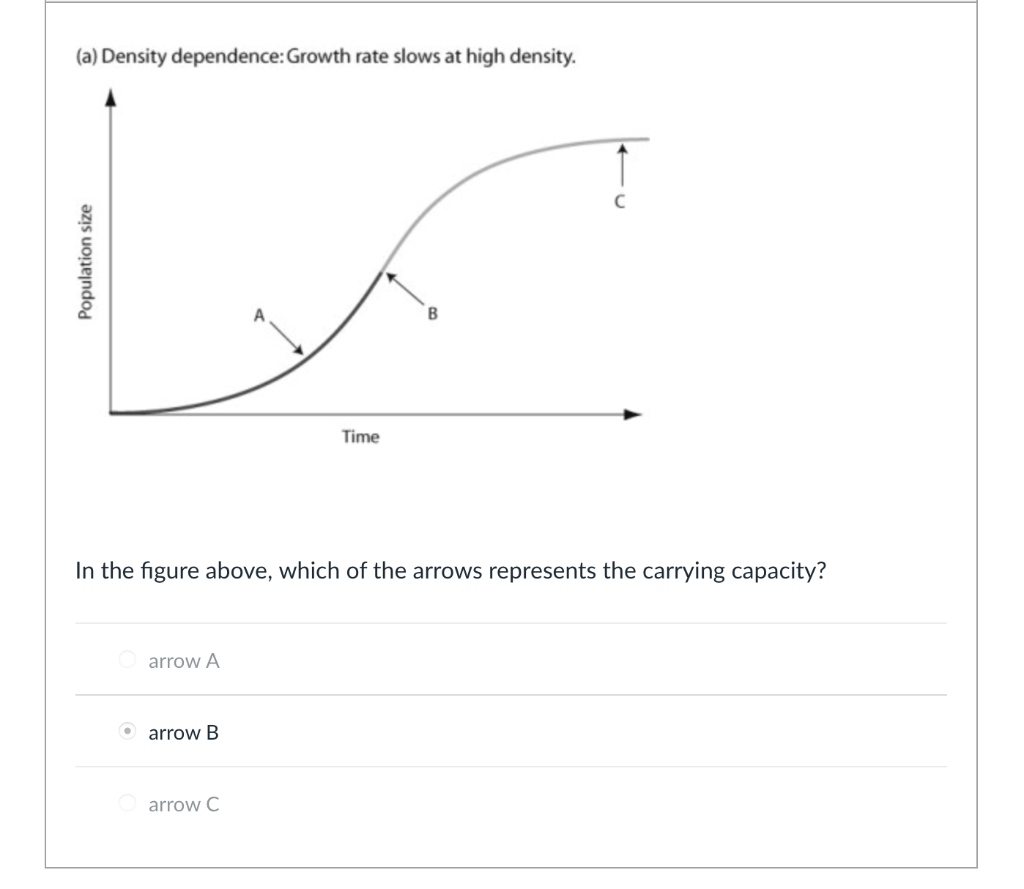
(a) Density dependence: Growth rate slows at high density. In the figure above, which of the arrows represents the carrying capacity? arrow A arrow \( \mathrm{B} \) arrow C
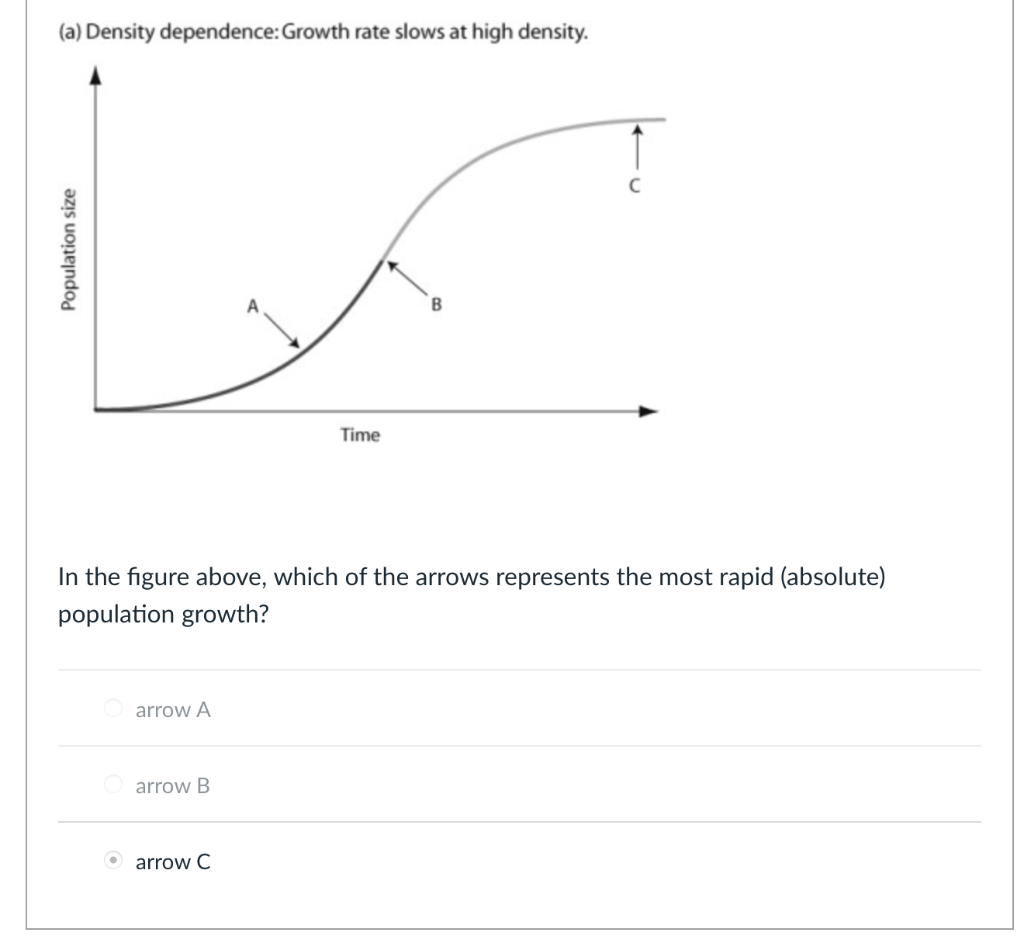
(a) Density dependence: Growth rate slows at high density. In the figure above, which of the arrows represents the most rapid (absolute) population growth? arrow A arrow B arrow C
Expert Answer
SOLUTION A :- Curve A represents exponential growth. Exponential growth occurs when the resources are available in abundance and thus the population grows really fast. . . SOLUTION ( B ) :-


