Home /
Expert Answers /
Economics /
in-figure-8-9-mathrm-a-the-market-equilibrium-output-and-price-of-the-bread-market-is-show-pa618
(Solved): In Figure \( 8.9 \mathrm{a} \), the market equilibrium output and price of the bread market is show ...
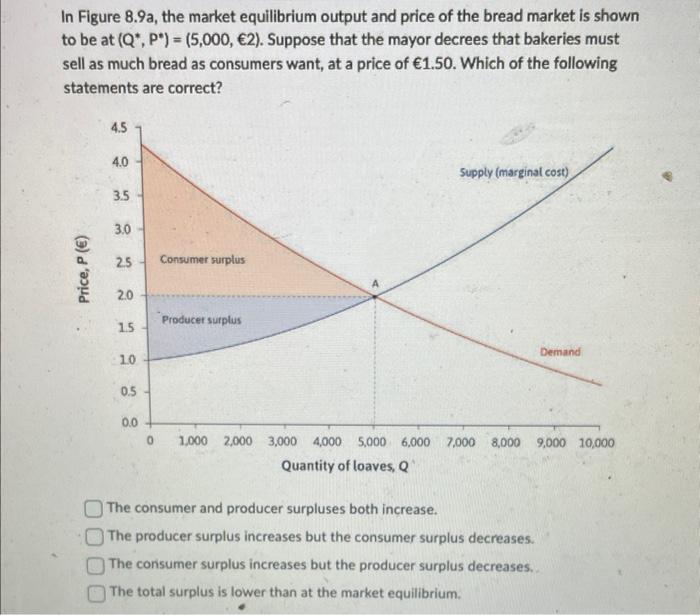
In Figure \( 8.9 \mathrm{a} \), the market equilibrium output and price of the bread market is shown to be at \( \left(Q^{*}, P^{*}\right)=(5,000, € 2) \). Suppose that the mayor decrees that bakeries must sell as much bread as consumers want, at a price of \( € 1.50 \). Which of the following statements are correct? The consumer and producer surpluses both increase. The producer surplus increases but the consumer surplus decreases. The consumer surplus increases but the producer surplus decreases. The total surplus is lower than at the market equilibrium.
The market demand curve of a particular good is downward-sloping. Based on this information, which of the following statements is correct regarding a price-taking firm producing that good? The firm chooses the price that equals its marginal cost. A price-taking firm cannot be profit-maximising. The demand curve faced by the firm is downward-sloping. The firm chooses its output such that the marginal cost equals the price.
Expert Answer
1. The market equilibrium price is 2 euros. If the government decreases the price at which bakeries must sell their product to 1.5 euros, it will lead