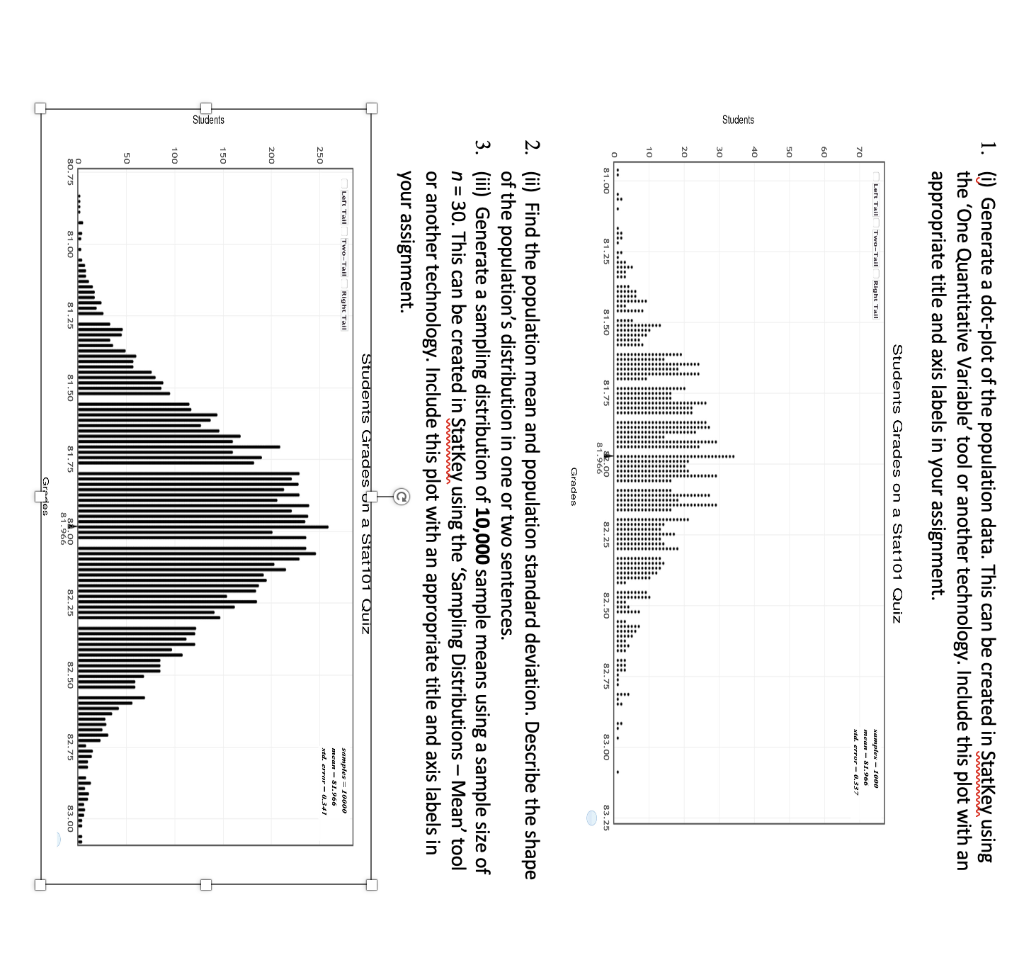
(Solved): (ii) Find the population mean and population standard deviation. Describe the shape of the pop ...
(ii) Find the population mean and population standard deviation. Describe the shape of the population’s distribution in one or two sentences. ( with the first dotplot with samples:1000)
(iv) Find the mean of the sampling distribution (“mean of the means”) and the standard deviation of the sampling distribution (standard error). Describe the shape of the sampling distribution in one or two sentences.
(v) In one or two sentences, comment on the differences and similarities between the population’s distribution and the sampling distribution from part (iii). Hint: comment on their mean, standard deviation and shape.
(vi) What proportion of samples (when n = 30) have sample means that are more than 90?
(vii) Explain in one or two sentences what changes to the sampling distribution you would expect if the sample size was increased to n = 100.
Helpp me answer these question with the dot plot attached thank you
Expert Answer
(ii) To find the population mean and standard deviation, you would need to have the data for the entire population. Without that information, I am una
