Home /
Expert Answers /
Advanced Physics /
i-39-m-having-trouble-understanding-the-meaning-behind-these-charts-for-wave-functions-the-wave-func-pa731
(Solved): I'm having trouble understanding the meaning behind these charts for wave functions. The wave functi ...
I'm having trouble understanding the meaning behind these charts
for wave functions. The wave function is the infinite square
well, 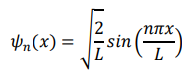
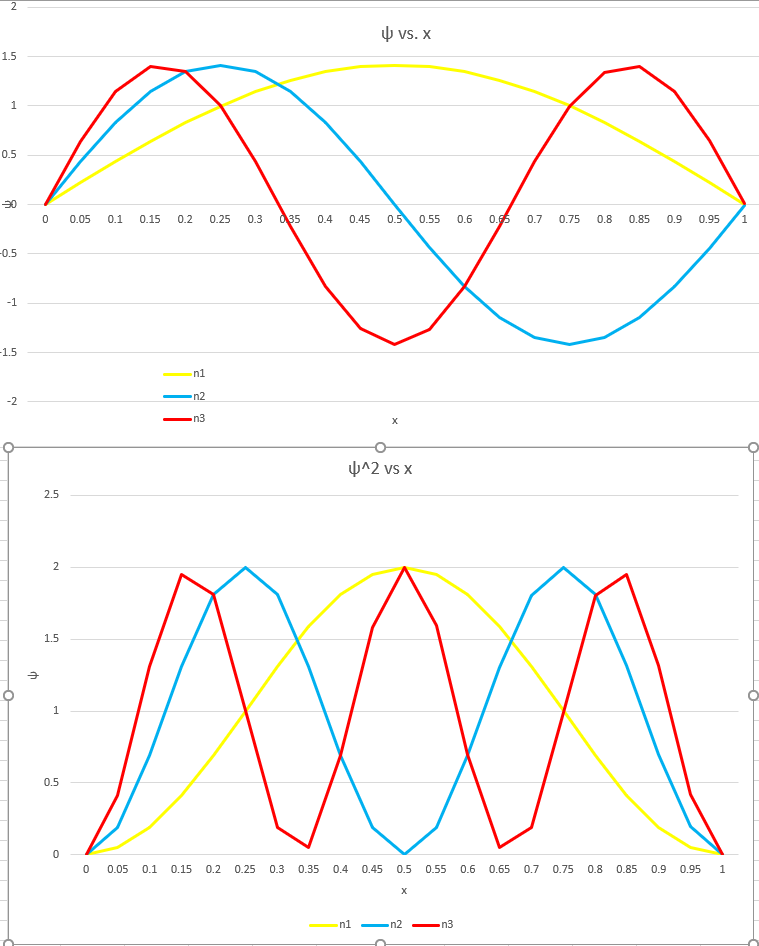
What do these graphs mean, how do they correlate, and what does it mean when the points/lines intersect?
Thanks in advance
\( \psi_{n}(x)=\sqrt{\frac{2}{L}} \sin \left(\frac{n \pi x}{L}\right) \)
2 \( \Psi \) VS. \( x \) \( 1.5 \)
Expert Answer
Solution : Actually only wavefunction has no physical meaning but if we take square of its mod, then it can be used to represent the probability density function of some system.