Home /
Expert Answers /
Statistics and Probability /
hi-and-good-day-based-on-the-secondary-ungrouped-dataset-given-all-the-example-and-information-a-pa882
(Solved): Hi and good day , based on the secondary ungrouped dataset given , all the example and information a ...
Hi and good day , based on the secondary ungrouped dataset given , all the example and information are in the pictures below ,
Please help me find :
- Measure of position ( first and third quartile )
- Provide the formula used
- Labelled each of the alphabets in the formula
- Nice handwriting
- Accurate answer
- Step-by-step calculations
- A full explanations
- Table
- Box-and-Whisker plot
- Graph ( if necessary )
Thank you
Reference : https://www.kaggle.com/datasets/fedesoriano/heart-failure-prediction
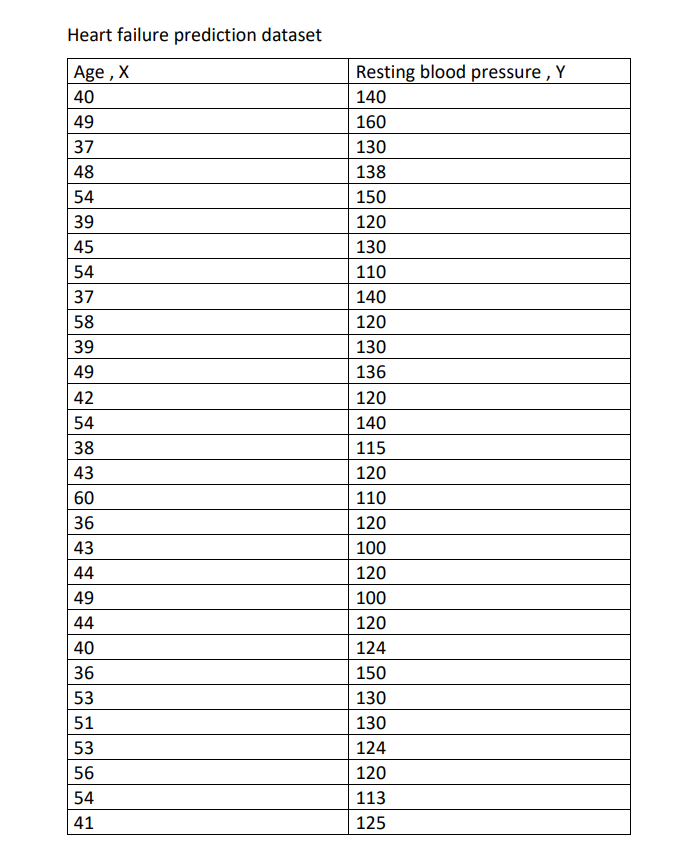

Heart failure prediction dataset Age, X 40 49 37 48 54 39 45 54 37 58 39 49 42 54 38 43 60 36 43 44 49 44 40 3555 36 51 56 54 41 Resting blood pressure, Y 140 160 130 138 150 120 130 110 140 120 130 136 120 140 115 120 110 120 100 120 100 120 124 150 130 130 124 120 113 125
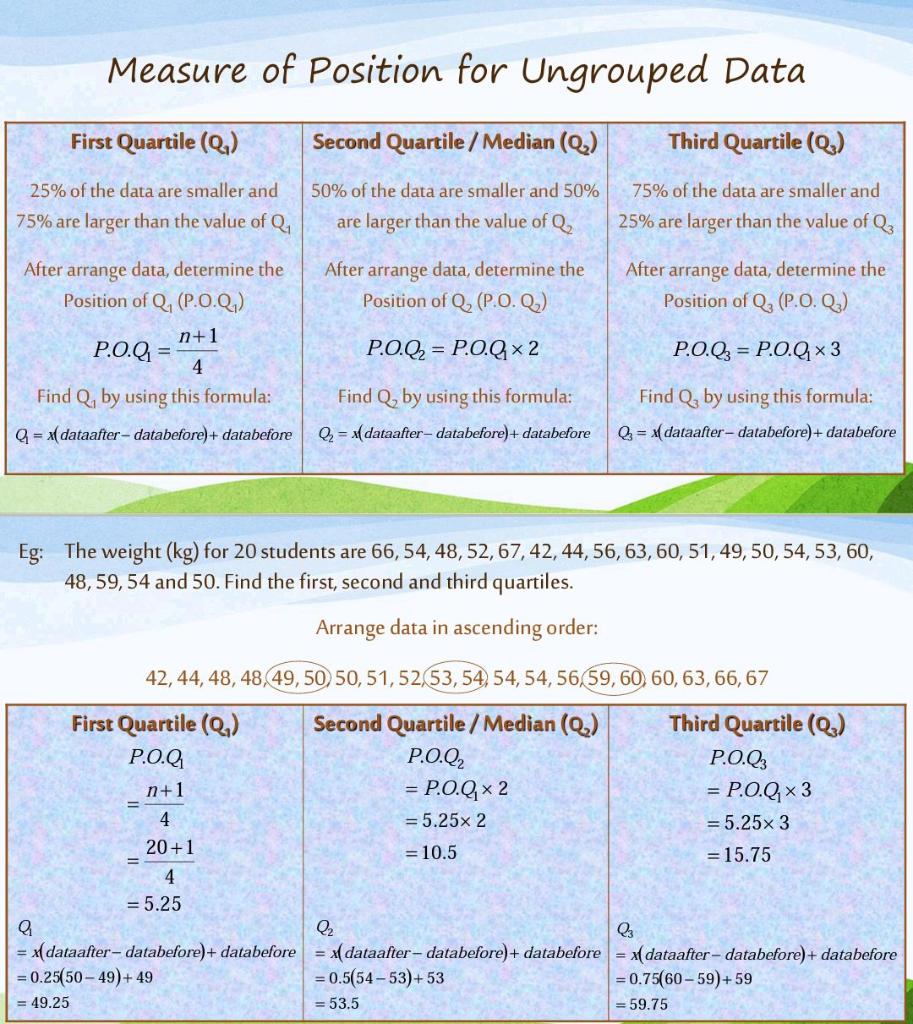
Measure of Position
Measure of Position for Ungrouped Data First Quartile (Q?) Second Quartile/Median (Q?) Third Quartile (Q) 75% of the data are smaller and 25% are larger than the value of Q 25% of the data are smaller and 75% are larger than the value of Q? After arrange data, determine the Position of Q? (P.O.Q?) 50% of the data are smaller and 50% are larger than the value of Q After arrange data, determine the Position of Q, (P.O.Q?) P.O.Q? = P.O.Qx2 P.O.Q3 P.O.Q×3 Find Q, by using this formula: Find Q, by using this formula: Q? = (dataafter-databefore) + databefore Q = (dataafter-databefore) + databefore n+1 4 Find Q, by using this formula: Q=x(dataafter-databefore) + databefore P.O.Q = First Quartile (Q?) P.O.Q Eg: The weight (kg) for 20 students are 66, 54, 48, 52, 67, 42, 44, 56, 63, 60, 51, 49, 50, 54, 53, 60, 48, 59, 54 and 50. Find the first, second and third quartiles. Arrange data in ascending order: 42, 44, 48, 48, 49, 50, 50, 51, 52, 53, 54, 54, 54, 56,59, 60, 60, 63, 66, 67 Second Quartile / Median (Q?) P.O.Q? n+1 4 20+1 4 = 5.25 After arrange data, determine the Position of Q3 (P.O. Q?) = P.O.Q?x 2 = 5.25x 2 = 10.5 = Third Quartile (Q?3) P.O.Q3 = P.O.Q? x 3 = 5.25x 3 = 15.75 G Q? = x(dataafter-databefore) + databefore = (dataafter-databefore) + databefore = x(dataafter-databefore) + databefore = 0.25(50-49) + 49 = 0.5(54-53)+53 = 0.75(60-59)+59 = 49.25 = 53.5 = 59.75
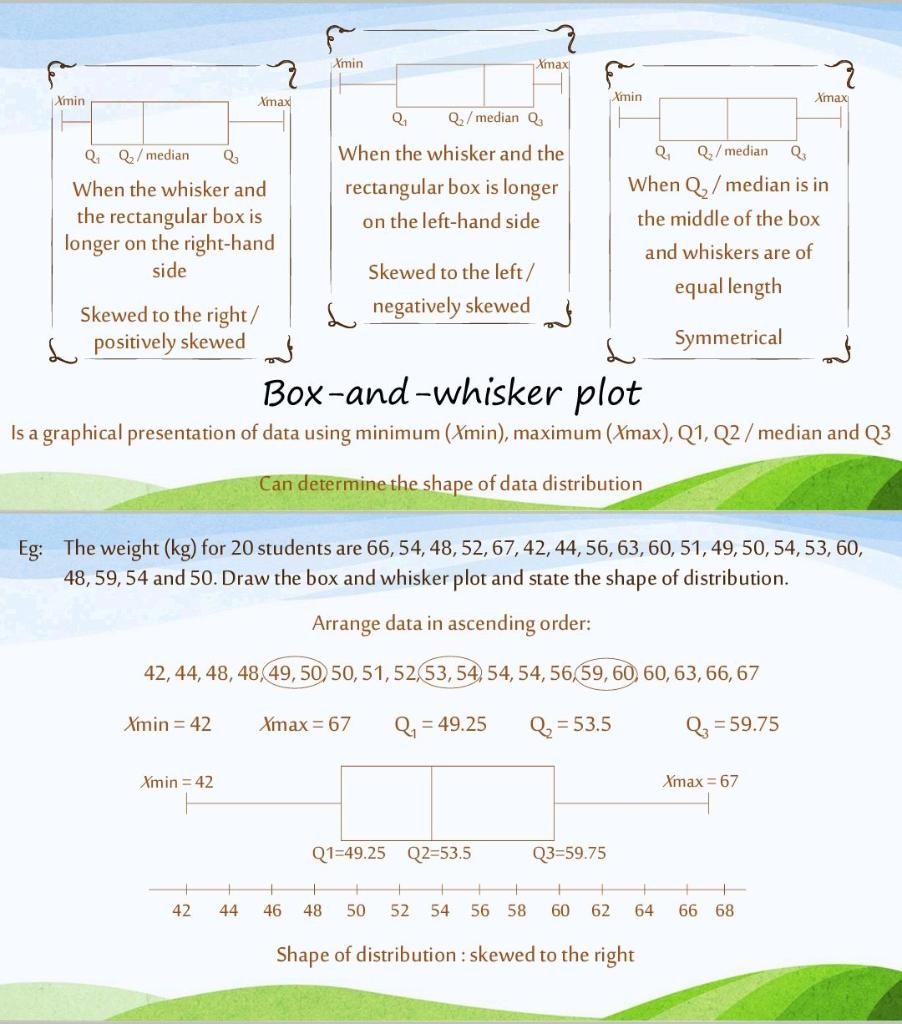
Xmin Q? Q?/median Q? When the whisker and the rectangular box is longer on the right-hand side Skewed to the right/ positively skewed Xmax Xmin = 42 Xmin = 42 42 44 Xmin Xmax Q? Q?/median Q? When the whisker and the rectangular box is longer on the left-hand side Box-and-whisker plot Is a graphical presentation of data using minimum (Xmin), maximum (Xmax), Q1, Q2/median and Q3 Can determine the shape of data distribution 46 Eg: The weight (kg) for 20 students are 66, 54, 48, 52, 67, 42, 44, 56, 63, 60, 51, 49, 50, 54, 53, 60, 48, 59, 54 and 50. Draw the box and whisker plot and state the shape of distribution. Arrange data in ascending order: 42, 44, 48, 48, 49, 50, 50, 51, 52, 53, 54) 54, 54, 56, 59, 60, 60, 63, 66, 67 Q? = 49.25 Xmax = 67 Skewed to the left/ negatively skewed Xmin = 53.5 Q3=59.75 Q? Q?/median Q3 When Q?/median is in the middle of the box and whiskers are of equal length Symmetrical Q1 49.25 Q2=53.5 + 48 50 52 54 56 58 60 62 64 Shape of distribution: skewed to the right Xmax = 59.75 Xmax = 67 66 68