Home /
Expert Answers /
Biology /
here-is-a-graph-showing-absorption-over-time-for-an-enzyme-reaction-you-want-to-calculate-enzyme-a-pa230
(Solved): Here is a graph showing absorption over time for an enzyme reaction. You want to calculate enzyme a ...
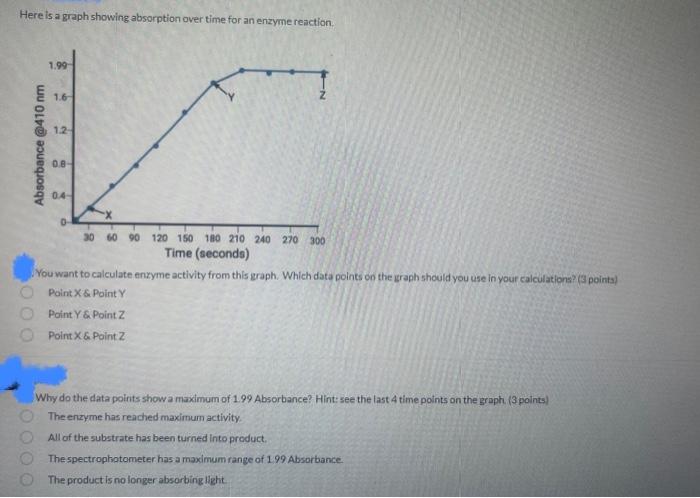
Here is a graph showing absorption over time for an enzyme reaction. You want to calculate enzyme activity from this graph. Which data points on the graph should you use in your calculations? (3 pointa) Point X \& Point Y Point Y E. Point Z Point \( X \) \& Point 2 Why do the data points show a maximum of \( 1.99 \) Absorbance? Hint: see the last 4 time points on the graph. (3 points) The enzyme has reached maximum activity. All of the substrate has been turned into product. The spectrophatometer has a maximum range of 199 Absorbance. The product Is no longer absarbing light.
Expert Answer
The rate of reaction can be calculated